
ADVANCED METERING INFRASTRUCTURE (AMI)
ADVANCED METERING INFRASTRUCTURE (AMI)
Another effort by TNB towards grid modernization is the introduction of the Advanced Metering Infrastructure (AMI) project. AMI is an integrated and intelligent system that comprises smart meters well-equipped with digital features that provide near real-time data through our myTNB web portal and mobile apps, allowing customers to monitor and manage their electricity usage efficiently. Customers with smart meters can gain insights into their energy consumption through half-hourly energy usage analysis. The granular information provided by smart meters benefits not just to our clientele but also empowers our operations to pinpoint grid issues and understand consumer behaviours for more effective service delivery. By providing access to this information through the myTNB mobile app and myTNB Portal, customers acquire the ability to optimise their energy consumption, leading to reduced costs and a minimised environmental impact.
This initiative aligns with TNB’s commitment to Goal 8 of the UN Sustainable Development Goals (SDG) and Strategic Thrusts 2 (Key Economic Growth Activity) of the Shared Prosperity Vision (SPV) 2030. It aims to build resilient key economic sectors, particularly in the areas of green economy and renewable energy. Smart meters play a pivotal role in driving productivity, fostering digital innovation, and enhancing efficiency. They contribute to improving customer experiences through digitalisation.
 |
Digital Billing
No more waiting for your bill in the mailbox as the smart meter records your electricity use, and automatically sends your meter reading directly to us through a secured network. You can view your bill through the myTNB App or myTNB portal anytime, anywhere. |
 |
Track Your Electricity Usage
Smart meters will show your daily and monthly home electricity usage through the myTNB App. This information puts you in control of your energy usage and helps you become more energy-efficient. |
 |
Go Green!
Saving energy will not only benefit your wallet, but it will also impact the environment. it is a win-win! With smart meters, it is easier for you to track your electricity consumption and make changes to your energy usage. |
 |
Energy Budget
Stay on top of your monthly usage by setting up your Energy Budget on the myTNB App and monitoring your energy consumption. You will be alerted when you are reaching your budget threshold, helping you be more mindful of your energy consumption. |
Figure 1: Smart Meter Key Benefits
Apart from enabling NEM customers and providing better network visibility to TNB, the smart meter also provides various types of smart offerings and benefits to the customer.
| Types of Smart Benefits | Description |
| Actual and Timely Electricity Bill | Smart meter gives actual readings in 30 minutes interval; hence no site meter reading by meter reader is required. Timely electricity bill will be available in myTNB web portal and app. |
| Manage Electricity Consumption real time via myTNB Web Portal and Mobile App | Smart Meter customers could view detailed information on their energy consumption (down to 30 minutes’ interval) and electricity bills through myTNB web portal and mobile application, which empower customers to better manage their electricity usage and be more energy efficient. |
| Energy budget | Customers will receive alert notification via myTNB mobile application once they have reached the energy usage threshold limit set earlier. This feature allows customers to be more aware and purposeful in their energy usage from time to time, which will contribute to savings in their electricity bills. |
| (Power Outage Notification) Notification of electricity supply interruption & restoration | Notification of electricity supply interruption and restoration – Customers will receive timely information on power outages and updates on when power will be restored via myTNB App instead of calling TNB Careline to obtain update on the electricity supply situation. Hence, notifications of supply disruptions will reduce complaints and inquiries from customers. |
| Time of Use (ETOU) | This feature provides customers the choice to opt for ToU tariffs, which offer different pricing throughout various periods in a day e.g. peak, mid-peak and off-peak periods via Interval Billing Mechanism (IBM). As a result, customers could manage their energy usage according to the different tariffs offered in a day and enjoy reduction in monthly bills by shifting consumption to off-peak hours. Besides, with TOU implementation, the overall energy demand during peak-periods is reduced – resulting in lowered strain on grid infrastructure, increased energy efficiency and reduced customer impact. |
| (Faster Power Reconnection (Move in Move Out)) Remote Energisation and De-Energisation | With this feature, customers could connect and disconnect power supply remotely while moving in or out of their houses, and hence reducing the time for supply reconnection from up to 3 days by conventional method to within a day using smart meters – greatly enhancing existing customer experience. Customer could also choose the time and date at their convenience for connection and disconnection. |
| Smart Payment - Flexible Payment Scheme | This feature helps customers to control their energy consumption by empowering them to manage their energy budget and spending. Flexible Payment Scheme also enables the premise owner to control energy usage at rented premise and reduce the risk of unpaid bill by the tenant. It allows customer to opt for flexible payment options such as post-paid or prepaid plans. Besides, customers could top-up credit online without visiting a pay-point. |
Table 1: Types of Smart Benefits
As of 31 March 2025, a total of 72,429 meters has been installed for a cumulative total of 4,571,144 smart meters nationwide. AMI’s deployment in RP4 will mainly cover Penang, Johor, Perak, Kedah and Selangor. TNB aims to install 9.1 million smart meters across Peninsular Malaysia in phases under Advanced Metering Infrastructure (AMI) initiative. Figure 2 shows AMI Installation in FY2024.
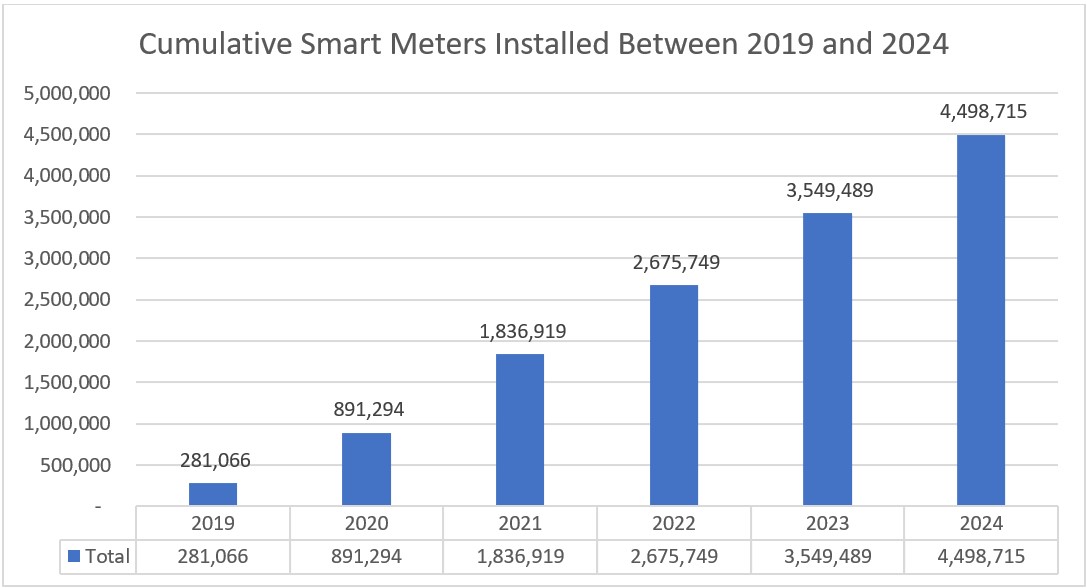
Figure 2: Smart Meter Yearly Installation
As one of the key enablers for Energy Transition, AMI is providing valuable network visibility for TNB and enabling customers to participate in solar energy generation as prosumers through the Net Energy Metering Scheme (NEM). To date, 60,860 customers have participated in NEM program supplying excess solar energy to the grid (Figure 3).
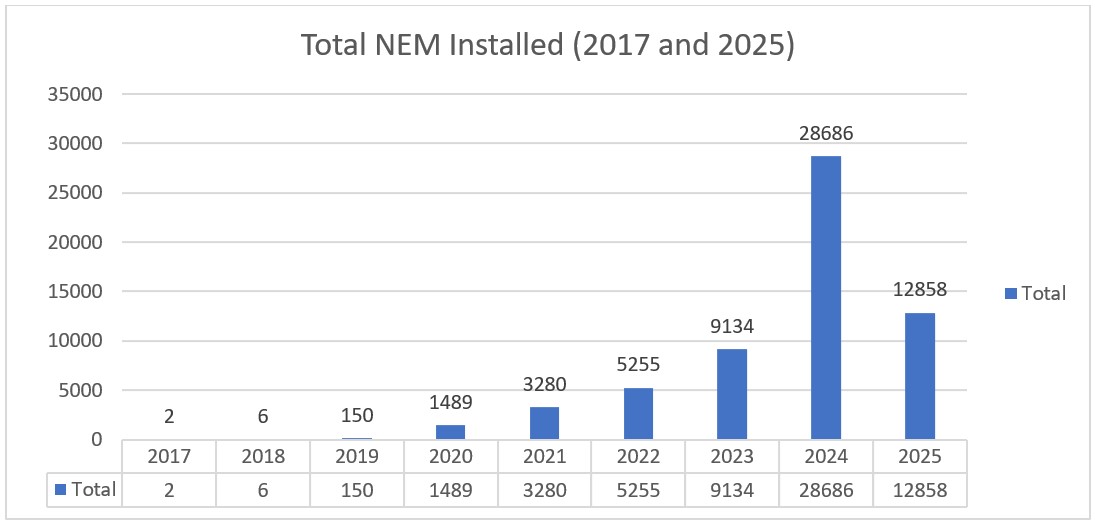
Figure 3: Smart Meter Yearly Installation
Deployment Schedule
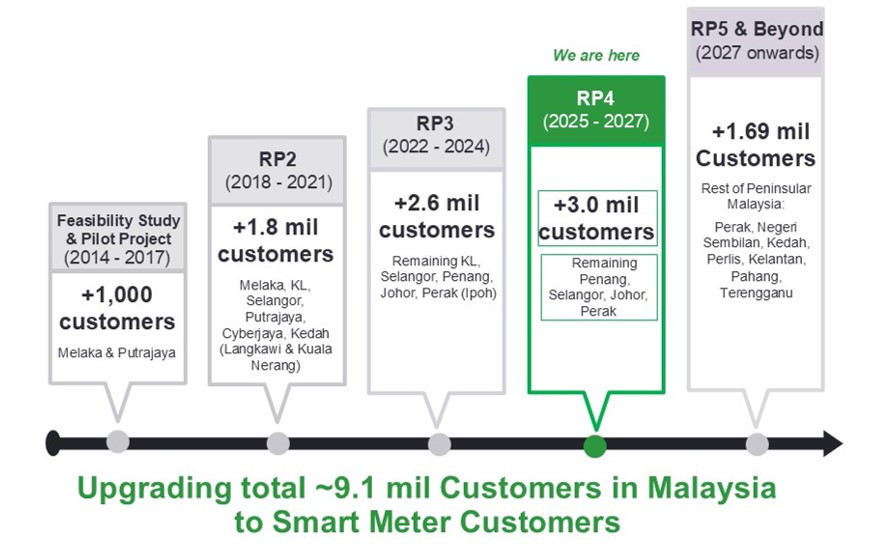
Figure 4: AMI Meter deployment plan
In 2024 deployment, AMI has targeted to exceed regulatory expectations, achieve sustainable implementation and deliver benefits towards customers. Moving forward in 2025, AMI Project is targeting to install 800,000 smart meters, for a cumulative total of 5.290 million meters.
AMI Architecture
AMI ecosystem comprising of the following components:
- Meter Data Management (MDM) is a critical component towards realising the full potential of Advance Metering Solution, especially when implemented prior to a large-scale residential rollout.
- AMI/ Automated Meter Reading (AMR) Impact on Utilities Business Processes: The implementation of AMI/AMR will have an immediate impact on utilities' business processes.
- A meter data management system facilitates the IT integration of AMI/AMR and streamlines the distribution of meter data across the utility enterprise. It frames the volumes of interval data retrieved from the field into manageable and familiar information.
- At a minimum, MDM provides a database repository and utility-specific business logic to:
- Automate and streamline the complex process of collecting meter data from multiple meter data collection technologies.
- Evaluate the quality of that data and generate estimates where errors and gaps exist.
- Deliver that data in the appropriate format to utility billing systems.
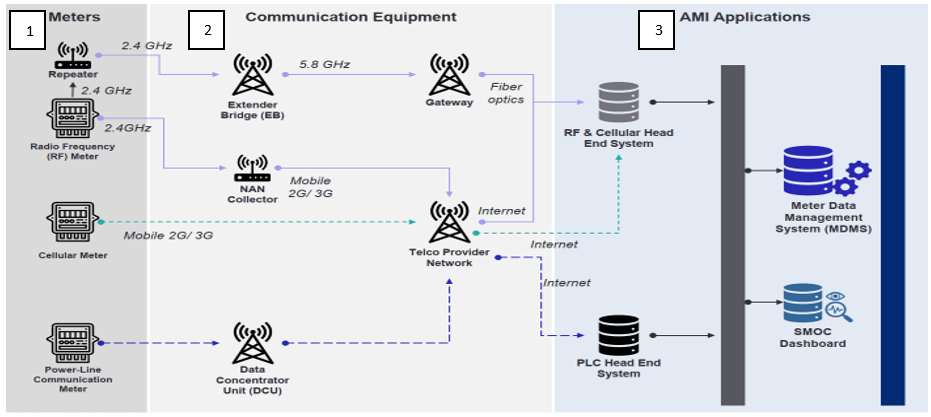
Figure 5: 3 Types of Communication Medium for AMI Ecosystem
TNB has deployed three types of technologies, including Radio Frequency (RF), Power Line Carrier (PLC), and Cellular, for smart meters and communication networks. Currently, the primary communication technology implemented in the Klang Valley is Radio Frequency (RF), which utilises the 2.4GHz and 5.8GHz frequency bands. Cellular technologies are mainly used in areas where it is not viable to use RF technologies, such as in low-density suburban or rural areas. PLC is currently limited to Melaka areas only. The meters use these three technologies to communicate back to the Head-End System (HES) located in the TNB data centre.
Meter reading and events data from smart meters are transmitted to the TNB Data Management System via communication networks (e.g., Repeater, NAN Collector, Extender Bridge, Data Concentrator Unit, Telco Network) and through the HES. This data is then used to enable smart customer offerings, some of which are currently available via the myTNB Mobile App, such as Auto-Billing, Consumption Monitoring, Energy Budget, and the NEM. In addition to obtaining meter reads and events, TNB can also send commands back to the meters, such as remote connection/disconnection, as well as perform over-the-air upgrades (e.g., firmware upgrades) of the smart meters without physically visiting the customer premises.
The Meter Data Management System (MDMS) receives meter data from the HES, validates, processes, and stores the data before transferring it to downstream systems for billing, reporting, and analysis.The Core functionality of the MDMS platform include:
|
|
Table 2: Core functionality of the MDMS platform
In general, the MDMS provides a database repository and utility-specific business logic to:
- Automate and streamline the complex process of collecting meter data from multiple technologies.
- Evaluate the quality of the data and generate estimates where errors and gaps exist.
- Deliver the data in the appropriate format to utility billing systems.
The Meter Data Management System (MDMS) is a critical component to realizing the full potential of advance metering solution, especially for large-scale residential rollout. Implementation of AMI will have a major impact on the utility’s business processes and requires extensive integration to various new and existing systems across the business. A meter data management system eases IT integration of AMI and facilitates the distribution of meter data across the utility enterprise by framing the volumes of interval data retrieved from the field into manageable and familiar information.
XADVANCED ASSET & GRID ANALYTICS FOR MONITORING, FORECASTING, AND DECISION SUPPORT
ADVANCED ASSET & GRID ANALYTICS FOR MONITORING, FORECASTING, AND DECISION SUPPORT
In today's evolving energy landscape, the demand for reliable, efficient, and sustainable energy infrastructure has never been higher. Electrical grids are the lifeline of society, yet aging infrastructure and rising energy demands continue to pose significant challenges. To address this, TNB has developed an Asset Management Plan, underpinned by the internationally recognized ISO 55001:2014 Asset Management certification, which emphasizes the balance of cost, risk, and performance across the asset lifecycle.
In line with this framework, TNB has deployed Advanced Asset & Grid Analytics applications that transform raw operational data into actionable insights. These initiatives covering asset health monitoring, dynamic grid forecasting, fault analysis, and investment decision support to operationalize the ISO 55001 principles by ensuring data-driven decision-making, optimized maintenance strategies, and smarter capital investment planning.
GRID DIGITAL INTELLIGENT INFRASTRUCTURE (GDII) FOR HV ASSET MANAGEMENT
The Grid of the Future comprises two critical components: Grid Modernization and Grid Digitalization. Without the integration of both, the realization of a Smart Grid remains unattainable. Since 2018, TNB has diligently crafted a comprehensive strategy known as Grid Digital Transformation, aimed at addressing the complex energy trilemma encompassing supply security, affordability, and sustainability. We firmly assert that digital technologies can play a pivotal role in achieving these strategic objectives:
- Managing the risk of aging asset profile
- Ensuring prudent asset investment
- Facilitating optimization of generation costs
- Promoting operational excellence
- Positioning Grid as an organization for the future of work
- Championing the energy transition
Attaining real-time visibility into grid assets offers a substantial improvement in our capacity to predict failures with precision, thus enhancing our intervention capabilities. This proactive approach is instrumental in maintaining the efficiency and cost-effectiveness of our Routine Maintenance and Operational Expenditures (OPEX). Indirectly, it yields considerable advantages for our customers by stabilizing electricity costs and ensuring a consistent, dependable power supply. Furthermore, enhanced observability of the grid empowers the implementation of advanced protective schemes and cutting-edge technologies, bolstering grid stability and reliability across expansive geographical areas.
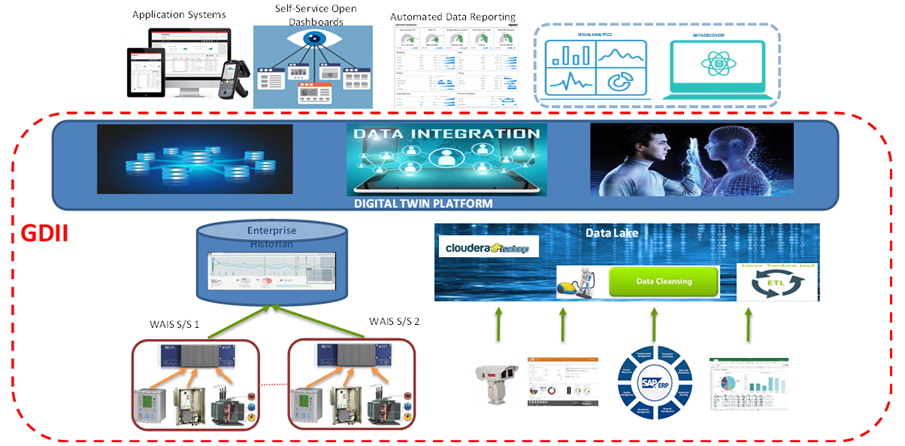
Figure 1: GDII high level system architecture diagram
A pivotal element in realizing the GDII initiative involves the deployment of an Enterprise Gateway (EGW) at the substation level. This sophisticated EGW serves as the central hub for the acquisition of real-time data from an array of devices, including Phasor measurement units, Remote Terminal Units (RTUs), Intelligent Electronic Devices (IEDs), Automatic Voltage Regulators (AVRs), sensors, and transducers situated within the substation. Subsequently, this EGW facilitates the transmission of this data to the enterprise-level historian.
Furthermore, the EGW assumes the dual role of an edge processor, responsible for the real-time processing of acquired data before forwarding it to the historian for additional analysis. In this capacity, it serves to trigger actionable responses, such as the issuance of maintenance notifications to the designated team members through email communication, thereby enhancing operational efficiency and reliability. In December 2024, EGW installation works and data mapping has been completed for all existing grid’s substation.
Through GDII, TNB managed to develop a few applications such as:
1. Centralized Equipment Condition Online Monitoring System (CECOMS)
CECOMS leverage on the installed EGWs capable of real-time status of all substations as a network twin (with switching control limit) to National Load Dispatch Centre (NLDC) enabling visibility of switching operation works carried out between control engineers’ of Grid System Operator and grid’s on-site personnel. Its capability extends to monitor the substation’s equipment health and condition including asset history, parameters and maintenance record.
In 2024, a Sentinel module was successfully integrated onto the PI-Aveva enhancing its capability especially the time series analysis and in 2025, the enhancement efforts continues with development in the pipeline to enhance this platform into Integrated CECOMS (I-CECOMS) as a centralize online monitoring system.
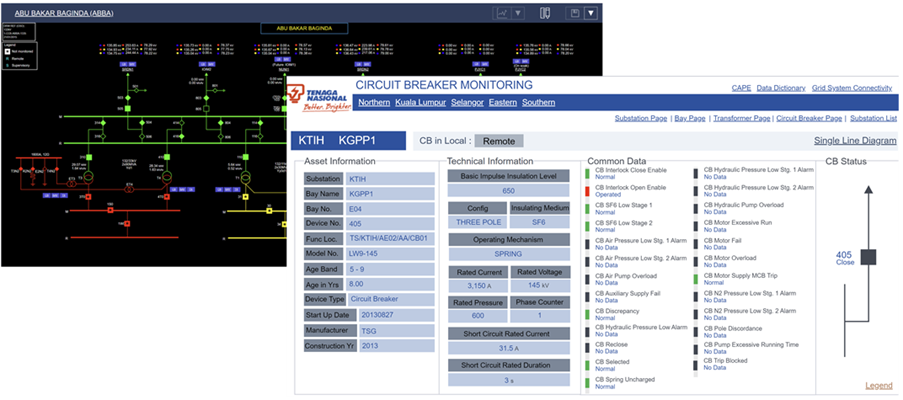
Figure 2: CECOMS
2. Self-healing Grid
A distributed platform to support custom protection and control system to sustain grid network stability and availability during disturbances and other power system contingencies. It incorporates real-time monitoring technologies (Synchrophasor, WAMS, SCADA, EMS, etc.) to determine network operational state through advanced analytics and deploy countermeasures to prevent escalation of events into major disturbances. It creates value in the following ways:
- Prevent widespread blackout
- Helps GSO to manage the grid in the most reliable and economical manner (optimizing cheaper generation)
In 2024, another scheme was successfully integrated, made the total number of 6 Special Protection Schemes (SPS) enhancing the grid's ability to manage contingencies effectively.
3. Automatic Fault Analysis (AFA)
When a fault occurs on the transmission system, detecting and diagnosing faults promptly is critical to minimize downtime and reduce the costs associated with repairs and maintenance on the transmission line assets. Prior to AFA, the process for fault analysis can be time-consuming and rely heavily on human expertise. To make fault detection and analysis more efficient, TNB has successfully develop an automatic fault analysis (AFA) software tool that can help automatically identify fault locations and performance data analysis. AFA functions including automated collection of disturbance-related data, synchronization of time-domain data, determination of fault location and performing fault analysis. Most importantly, AFA will capture data during a disturbance and send notification to the system operator almost immediately after the fault. AFA has proven to provide the following benefits:
- Reduced outage times with accurate fault location.
- Lower line patrol costs.
- Increased productivity by automating data compilation tasks, which expedite detailed event analysis.
- Increased system resilience, by performing structured verification of protection systems.
As of 2024, AFA recorded more than 90% accuracy fault locations determination and in 2025 AFA2.0 will be launched with enhanced features.
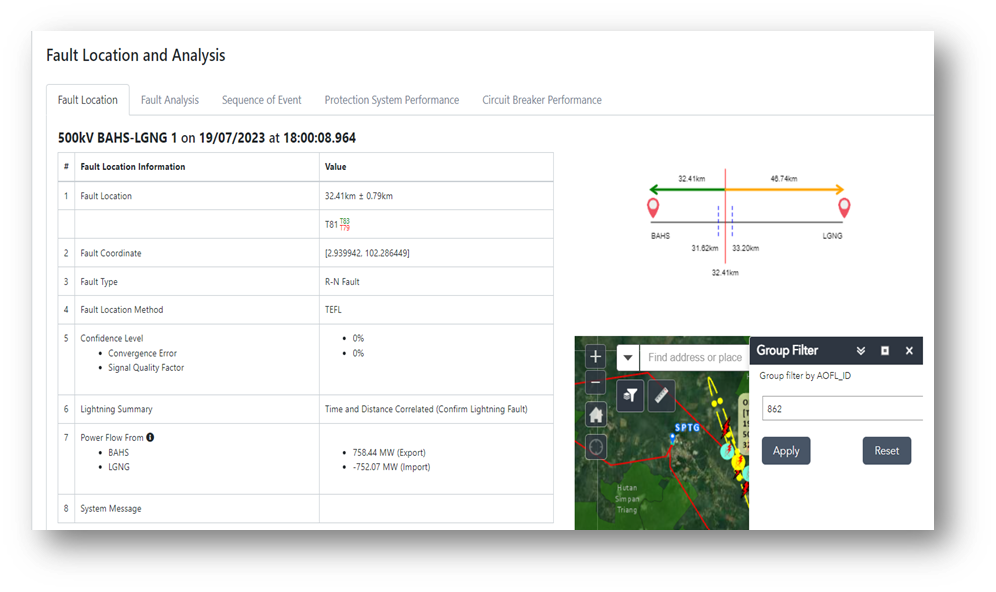
Figure 3: AFA performed fault analysis on overhead line related to lightning
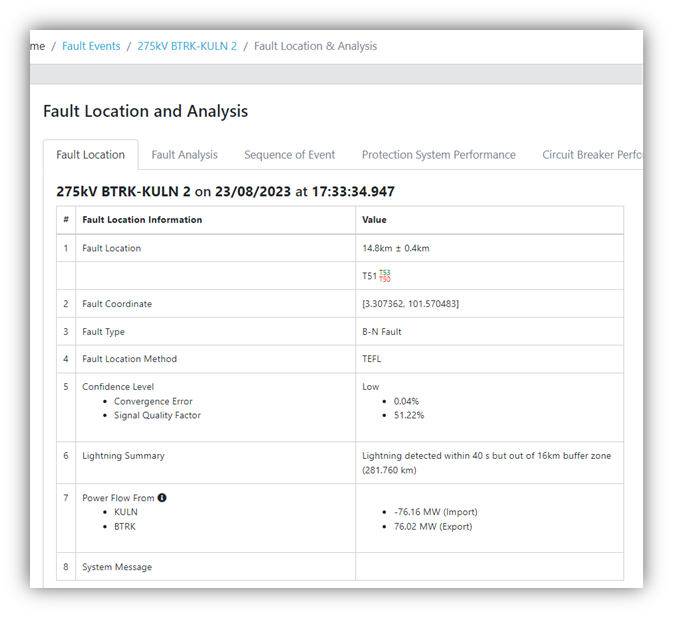
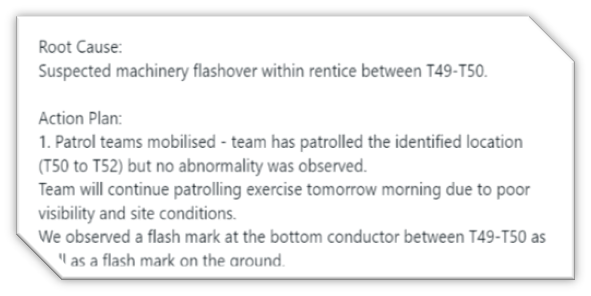

Figure 4: AFA performed fault analysis on overhead line related to permanent fault
4. DC System Monitoring
Substation Power Supply or DC system supplies power to control, protection, and monitoring devices within the substation. It plays a critical role in ensuring the proper functioning of the protection system. By installing sensors within the DC panel, it becomes possible to monitor the voltage profile of the DC system in real-time. Grid maintenance team is now able identify the presence of DC Earth Fault in short duration by analysing the pattern of real-time and historical data. It also provides a facility to detect any abnormality in substation DC supply before a serious DC supply failure occur.
5. CVT Monitoring
Voltage transformer is one of the most abundant assets within TNB. Historically, maintenance and assessment of these transformers have been conducted through manual means, involving on-site visits by maintenance teams to perform measurements and analyses. With the development of the Grid Digital Intelligent Infrastructure, voltage transformer monitoring can now be conducted in a smart and automated manner. Real-time voltage data is subject to online analysis using statistical methods to assess the overall health of the population. In case of any detected outliers, email notifications will be sent to the maintenance team for a secondary validation, prior to deciding on the most suitable corrective action.
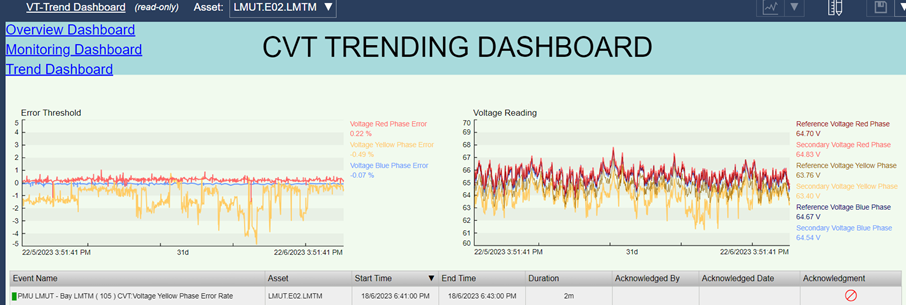
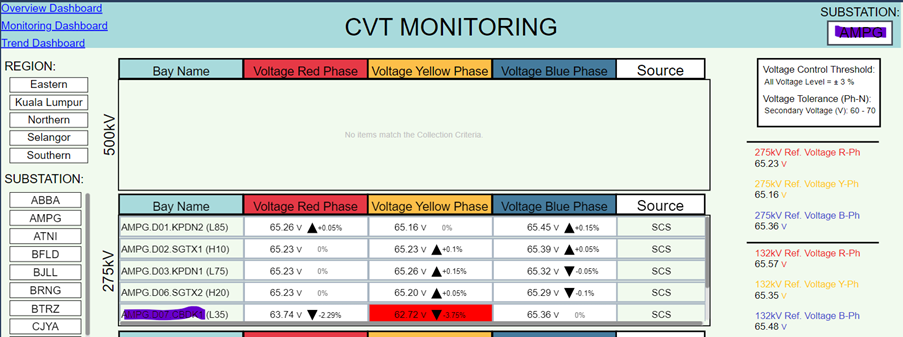
Figure 5: CVT Monitoring Dashboard
ASSET PERFORMANCE MANAGEMENT SYSTEM (APMS) FOR HV AND MV ASSET MANAGEMENT
TNB Grid and Distribution Network have implemented the APMS to facilitate the asset maintenance regime in ensuring the performance of critical asset and ensuring the reliability of the system. The solution enables visualization and analysis of asset health index in real-time, enabling risk-based maintenance and reduced core transmission expenditure. The APMS platform is designed to develop a methodology to represent asset health and asset criticality that allows asset owner or service engineer to decide on short term and long-term maintenance strategy. APMS aims to deliver three (3) main objectives which are:
- Optimise maintenance spend through introduction of Asset Risk Index through analytics.
- Integrate with Enterprise Resource Planning (ERP) and work management system to initiate work orders for repair and replacement.
- Unlock the capability of predictive maintenance and performance analysis, enhanced with integration with IoT sensors for near real-time data input.
Among the parameters that Asset Performance Management System (APMS) consider for its asset health index (AHI), asset criticality index (ACI) and asset risk index (ARI) are showed in the Table 1.
| Asset Risk Index (ARI) | |
| Asset Health Index (AHI) | Asset Criticality Index (ACI) |
|
|
Table 1 APMS - Transformer Asset Risk Index, Asset Health Index & Asset Criticality Index.
| Asset Risk Index (ARI) | |
| Asset Health Index (AHI) | Asset Criticality Index (ACI) |
|
|
Table 2 APMS – High & Medium Voltage Circuit Breaker Asset Risk Index, Asset Health Index & Asset Criticality Index
Following the result from the mentioned parameters, APMS will import all the testing results that were entered by maintenance crew to analyse the health index of the assets. Trigger limits are set in APMS and work scheduling can be released following the condition of the assets. One useful insight in APMS, the Maintenance Decision Intelligence (MDI) as shown in Figure 2B.6 utilizes advanced analytics algorithms based on the Common Network Asset Indices Methodology (CNAIM) and inputs from our TNB technical experts to generate asset health, criticality, and risk indices. The MDI is a simple decision matrix consisting of five color-coded regions that represents different levels of maintenance urgency thus giving engineers better insights into asset management decision-making such as to prioritize critical maintenance works or to carry out replacement tasks.
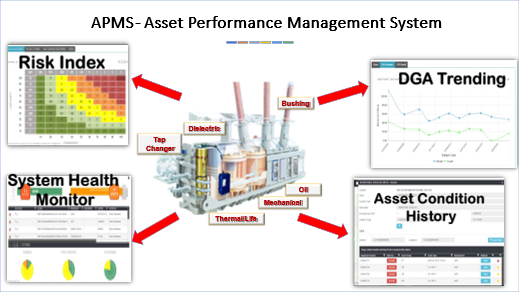
Figure 6: APMS Key Capabilities
Figure 7: APMS Dashboard
.jpg)
Figure 8: Maintenance Decision Intelligence (MDI)
APMS is the enabler to drive the organization digital transformation aspiration by providing data and trending to predict the different scenario based on the equipped remaining life model. The end goal is to have a seamlessly integrated system for asset performance management that enables TNB to optimize Asset Risk, Performance, and Total Cost of Ownership (TCO).
Future Development on APMS
A future enhancement roadmap the functionality APMS have been planned to ensure that the platform is capable to adapt to the newly installed devices like Online Monitoring System (OMS) and IoT sensors, expand its coverage to other current carrying assets like Current Transformer, Over-headlines, cables and etc. The functionality of APMS will be further stretched to facilitate the overall asset life cycle to allow a holistic approach based on the utility best practice for asset management.
INTERNET OF THINGS (IOT) SENSOR FOR NEAR REAL TIME DATA COLLECTION & INTEGRATION FOR MV ASSETS
This methodology entails the strategic deployment of a range of Internet of Things (IoT) sensors for comprehensive near real-time condition monitoring. These sensors serve as the vanguard of continuous data collection, providing a holistic view of asset health.
The types of IoT sensors employed include:
- Thermal Sensors: These sensors monitor temperature variations within assets, allowing us to detect overheating or abnormal thermal patterns that could indicate potential issues.
- Partial Discharge Sensors: These sensors detect partial discharges within assets, which can be indicative of insulation degradation or other internal problems.
- SF6 Gas Density Sensors: Monitoring SF6 gas density helps us assess the condition of equipment and detect gas leaks, ensuring safety and asset integrity.
- Dissolved Gas Analysis (DGA) Sensors: DGA sensors analyse the gases dissolved in transformer oil, providing insights into the condition of transformer insulation and potential faults.

Figure 9: Type of IoT Sensors and Tools
The detailed information on overall asset management process flow, data flow as well as high level architecture from IoT sensors into analytics engine are listed below:
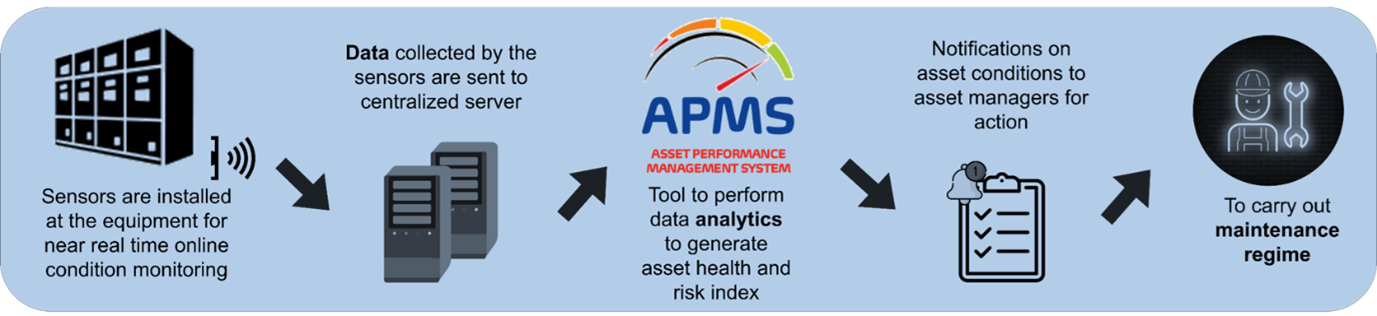
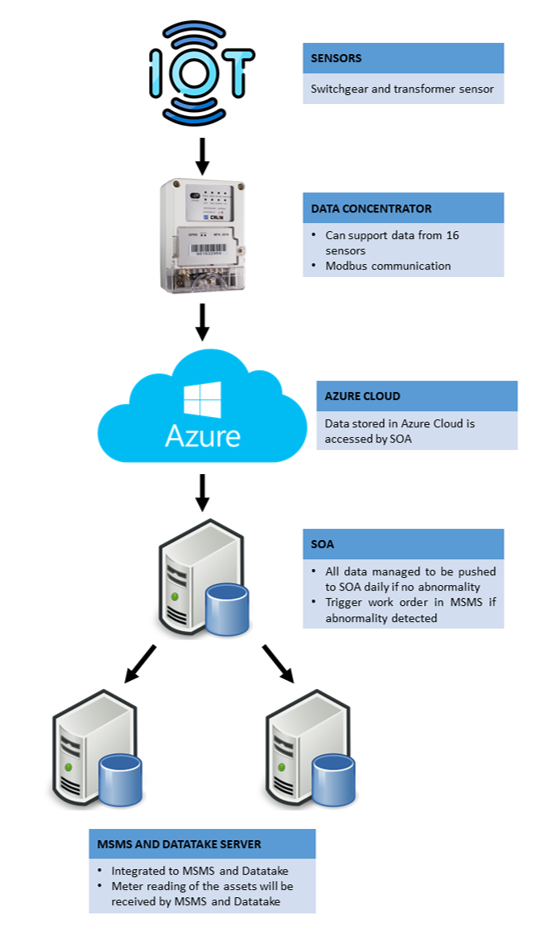
Figure 10: Process flow of end-to-end monitoring via IoT sensors & IoT Data Flow Architecture
Achievements and Benefits
Following through from the integrations, APMS has begun demonstrating tangible results and trends to aid asset management decision-making. In 2023 alone, a significant milestone was reached as a total of 7154 Service Requests (SR) of both Priority 1 (low) and Priority 2 (medium) were seamlessly transmitted from APMS to the work management system. These requests prompted the creation of work orders, aligning with recommended actions for addressing asset needs. This seamless integration not only streamlines the workflow but also underscores the effectiveness of APMS in facilitating proactive maintenance measures and optimizing asset performance.
Performance Progress (Software)
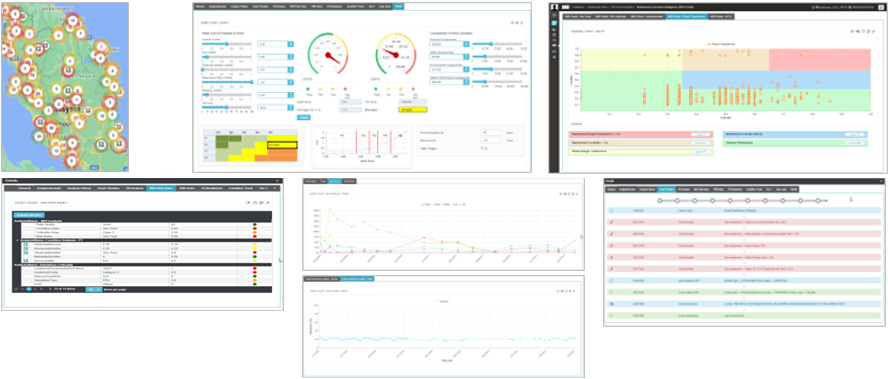
Figure 11: Results and trends in APMS to assist asset management decision making
Performance Progress (Hardware)
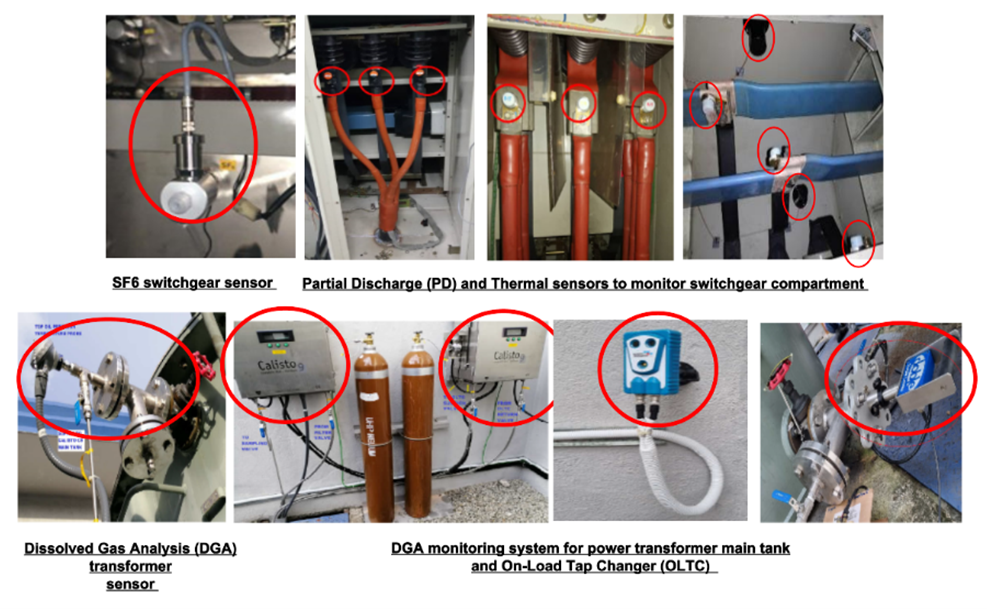
Figure 12 Installation of IoT sensors at selected main distribution substations
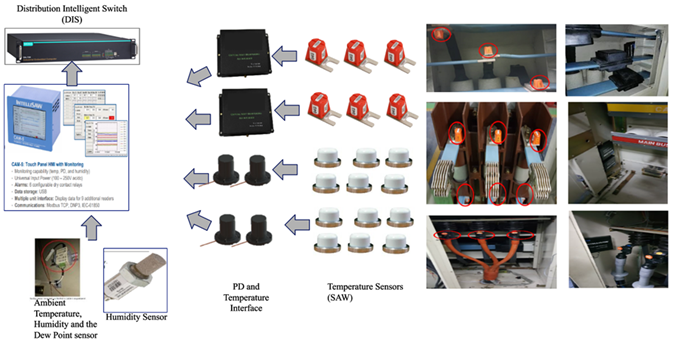
Figure 13: Monitoring MV Switchgears: (PD/Thermal) for AIS
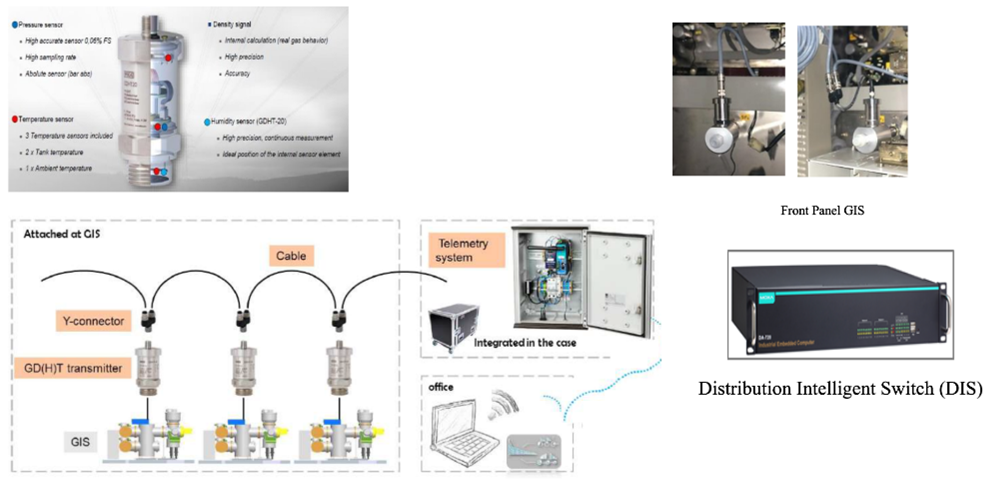
Figure 14: Monitoring MV Switchgears: (PD/Thermal) for SF6
![]()
Figure 15: Monitoring of 33/11 kV Power Transformers
Since its inception, the AAA project has achieved noteworthy milestones, delivering benefits that extend well beyond cost savings. One prominent achievement is the significant enhancement of safety measures for our workforce. By deploying IoT sensors for real-time condition monitoring, workers encounter fewer high-voltage equipment interactions during maintenance activities. This reduction in exposure significantly diminishes the inherent risks associated with manual inspections.
Furthermore, the accuracy of asset health assessments has witnessed a remarkable enhancement. Unlike conventional manual scanning conducted from outside the equipment, the strategically positioned sensors within the equipment itself enable highly accurate, real-time data collection, resulting in precise asset health evaluations.
Moreover, continuous monitoring facilitated by IoT sensors obviates the need for periodic checks during maintenance visits. This proactive asset management approach ensures the timely identification and resolution of issues, reducing the risk of unforeseen failures and supply interruptions.
The analytics engine, APMS, standout feature is its capability to predict the rate of change (RoC) in asset conditions. This predictive prowess empowers us to anticipate asset deterioration before reaching critical levels. Armed with this foresight, TNB can proactively schedule maintenance or replacements, mitigating costly downtime and ensuring an uninterrupted power supply to our valued customers.
Other analytics-driven projects to facilitate asset management:
| Project | Description |
| Intelligent Predictive and Diagnostic Monitoring (IPDM) System | Utilizes software that enables plant operators to detect anomalies in the operations of major assets, thus allowing for early preventative actions. |
| Drones | Aerodyne drone services to perform Condition Based Maintenance (CBM) of bare overhead lines nationwide. |
| Online Monitoring System for Gas Analysis | Assesses the condition of transformer bushings and gas-insulated switchgear. |
| Automatic Fault Analysis and Fault Location Identification System | Assists operation and maintenance team for faster decision-making during restoration processes. |
| Geographic Information System | Provides accurate location information to manage, operate and analyse TNB’s network assets. |
| UAV LiDAR System (New initiative) | Developed an automated detection system to ensure the selection of proposed transmission line routes will avoid sensitive and/or endangered species during planning. |
| Predictive Analytics for 11kV Underground Cable Failure using Machine Learning | To predict 11kV underground cable failure probability based on historical data set and correlation between maintenance data and breakdown data, using machine learning technology. |
Table 3: Analytics driven projects
Use Case in Klang Valley (2022-2024)
The AAA project's journey began with a pilot rollout in the Klang Valley from 2022 to 2024. This initial phase allowed us to validate the technology, fine-tune our processes, and gather invaluable data. The Klang Valley pilot serves as a testament to our commitment to excellence through thorough testing and validation before full-scale deployment.
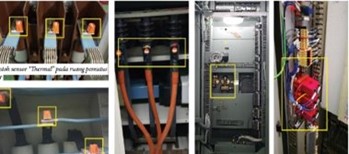
Figure 16: Sensors installed on breaker
Impact on Customers
The AAA project brings substantial benefits to our customers by minimizing both planned and unplanned shutdowns. By proactively addressing asset health issues, we significantly reduce the frequency and duration of supply interruptions. This ensures that our customers enjoy a more dependable power supply, contributing to their convenience and productivity. The reduction in unplanned shutdowns also leads to improved customer satisfaction and trust in TNB's commitment to service excellence.
Environmental and Community Impact
The AAA project aligns harmoniously with global environmental objectives by reducing carbon emissions through the prevention of unscheduled maintenance and repair activities. TNB's unwavering commitment to excellence extends to the communities we serve. The AAA project indirectly benefits these communities by guaranteeing a stable and uninterrupted power supply. This support sustains economic activities and enhances overall quality of life, affirming TNB's role as a responsible corporate entity.
Future Target State Capabilities
This comprehensive infrastructure enhancement project encompasses a range of initiatives aimed at optimizing the performance and reliability of the distribution network. Firstly, it involves the expansion of IoT sensors, with a focus on their installation in Criticality Class 1 substations and linear assets. Concurrently, IoT test equipment will be deployed in bulk to support field crews in their operations. The project also includes the expansion of the analytics engine to encompass various asset types, such as underground cables, overhead lines, and protection devices.
To ensure a seamless integration of data and analytics, an end-to-end asset lifecycle analytics system will be linked with the Asset Investment Planning Management (AIPM) solution. Furthermore, this initiative delves into the realm of digital twins, where an accurate model of the physical distribution network interconnected assets will be created for simulating asset risk analytics.To bolster real-time monitoring and predictive capabilities, Distribution Network Asset Health Centre will be established, ensuring the continuous assessment of asset performance and utilization while forecasting potential asset failures. These strategic endeavours collectively aim to enhance the efficiency, reliability, and long-term sustainability of the distribution network.
ASSET INVESTMENT PLANNING & MANAGEMENT (AIPM) FOR HV ASSET MANAGEMENT
Asset Investment Planning and Management (AIPM) is a strategic asset management practice used by best-in-class organisations to realize the highest value from existing assets and select future opportunities that will provide the greatest return to the organisation.
Key Features/Functions:
The Asset Investment Planning Management (AIPM) project has a total of six (6) expected deliverables which includes:
- Systematic & consistency in investment decision making
- Optimum, prudent & timely investment under IBR
- Transparent investment proposal to regulator
- Realization of values for every dollar spent on asset
- Manage dynamic & flexible IBR environment & other constraints
- Create long-term & efficient investment strategy while proactively managing risks
_System.jpg)
Figure 17: Simplified operating model of Asset Investment Planning Management (AIPM) System
Among the critical path that is associated with the Asset Investment Planning Management (AIPM) project is value identification where all core values of the organizations need to be determined agreed by all departments. A total of seven (7) value models have been identified as the core values of the organization which covers from compliance, corporate, environmental, financial, image / reputation, reliability and safety and health. In extension to that, the seven (7) value models are further divided into twenty-two (22) sub-models that represent the diverse risk or expected benefit that are commonly recognized through the purpose of investment in transmission utility. Ultimately, it reflects all the concerns, problem, risk and desired expectation in the organization, stakeholders and regulator in the framework of monetize value. Endorsement by the top management on the value models as it set the direction for decision making for the future in dealing with all investments.
AIPM also focuses on alignment of value models and calculation parameters. For tangible value models, different calculation formula will be formed to derive the risk value or benefit value, for example reliability - supply interruption / supply performance is calculated based on expected unserved energy and probability of failures. While for non-tangible values is based on a set of consequence that are separated into five (5) degrees level from insignificant, minor, moderate, major and catastrophic which can be compared in monetized value. Alignment of processes that are associated with the decision making on investment is also considered in Asset Investment Planning Management (AIPM) System design. This is to provide standardized process for all investment proposal and having a clear line of sight for all the required approving processes and enable organization-wide portfolio monitoring and tracking.
In 2024, all of the CAPEX investment initiatives and projects proposed for RP4 proposal to the regulators were evaluated by the AIPM.
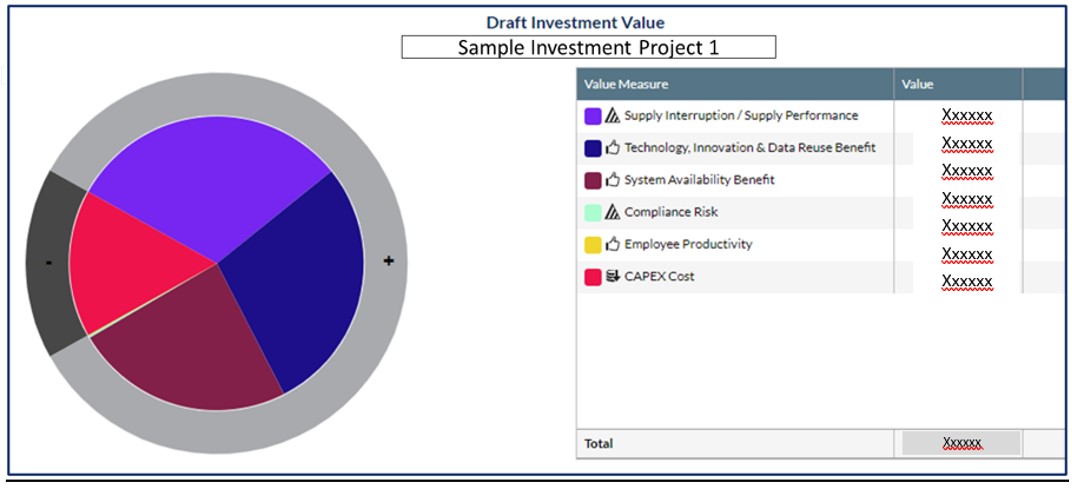
Figure 18: Draft Investment Value
I-NET & ASSET INVESTMENT PLANNING & MANAGEMENT (AIPM) FOR MV ASSET MANAGEMENT
Advance asset analytics projects also encompass network management to enhance the overall resiliency of the grid. This comprehensive approach ensures that the network is robust enough to cater to a wide range of operational challenges and external factors. By continually monitoring the performance of grid assets and analysing network data, these initiatives empower grid operators to respond effectively to adverse conditions such as extreme weather events, cyber threats, and changing load patterns. Through proactive measures as highlighted in the project below, real-time insights, and dynamic adjustments, the grid can adapt and maintain its dependable service, ultimately delivering sustainable, reliable electricity to meet the ever-growing energy demands of our modern society.
i-NET (Integration Network Expansion Tool)
i-NET is an analytical solution custom built for distribution network planners to facilitate Centralised Planning and Capacity Allocation Management. It was a digitalisation initiative to enable effective realisation of Smart Utility 2025 masterplan of DN which demands accurate network planning of dual power flow system, centralised governance of efficient planning, overall optimisation of CAPEX planning and management as well as productivity improvement to cater for job enhancement of planning unit to take up additional tasks related to grid modernisation.
Figure 19 below illustrates the high-level solution framework of i-NET implementation for distribution planning as a part of Enterprise Asset Management System (EAMS). Traditionally the architecture of EAMS consist of Enterprise Resource Management System (ERMS), Asset Performance Management System (APMS), Asset Investment Planning and Management (AIPM) and Project Portfolio Management (PPM).
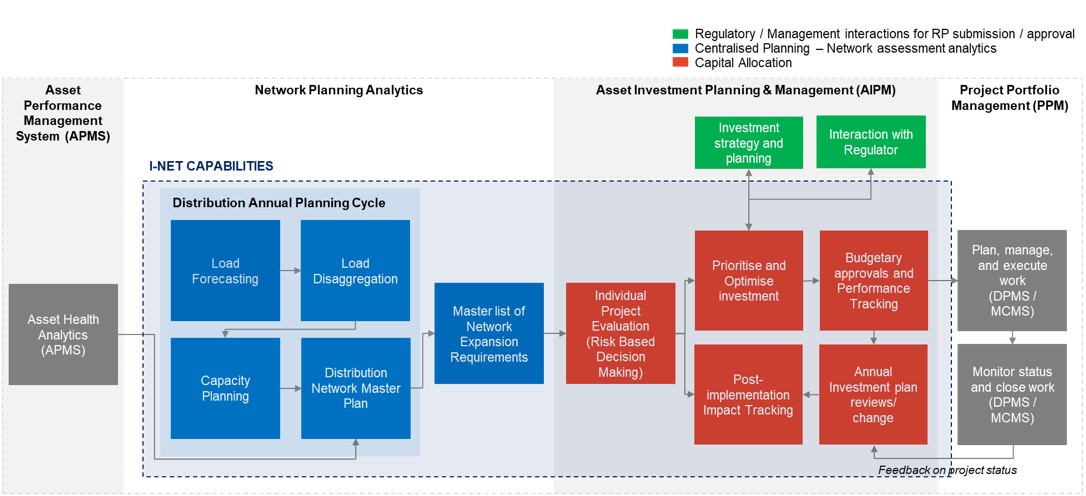
Figure 19: High level solution framework of i-NET Capabilities
While completing the traditional building blocks of EAMS, i-NET goes beyond the basic requirements of EAMS i.e. capabilities of Network Planning Analytics is coupled with AIPM as a total solution for planners sandwiched between APMS and PPM.
I-NET is embedded with the customised methodology of Distribution Annual Planning Cycle analysis which generates network expansion requirements and becomes an input to AIPM where annual capital allocation is prioritised and optimised according to strategic objectives of the organisation
Hence, besides process automation, i-NET is a decision support system (DSS) and single source of truth for centralised planning and capital allocation with below features:
- A unified Platform for distribution annual planning cycle studies conducted by nationwide planners
- Centralised capex portfolio planning and management through risk-based evaluation and mathematical optimisation
- Automated data collection and result generation based on admin specified logics and user-friendly Graphical User Interface (GUI)
- Ad-hoc result simulation for unique scenario planning
- Convenient interactive analytical tool with custom built Visual Analytics Reporting
As a total solution for distribution planners, the capabilities of i-NET can be segmented into 2 major parts i.e. Centralised Network Planning Analytics and Asset Investment Planning and Management
1. Centralised Network Planning Analytics
The forecasting methodology adopted in i-NET allows advanced load forecasting capabilities. It is a progressive migration from simple time series forecast to a much-advanced multi-variant time series analysis which encapsulates time series as well as regression models. Time series analysis searches for recent trending as well as seasonal or recurrent relationship of demand with respect to time parameter. The multi-variant parameters used in this forecast model considers the influence of Peninsular Malaysia’s economic factors such as population, Gross Domestic Product (GDP), weather and others.
With demand by main intake substation as the dependent variable and the respective econometric factors (Weather, GDP, Population, Nos. of Household, Electricity price & Commercial floor space) as the independent variables, i-NET automatically identifies the best statistical fit by comparing against unlimited models. Any irregularities are automatically detected which produces forecasting result that is free from human error. Besides, in i-NET there are functionalities to configure impact of recurring or non-recurring events such as festive season, natural disasters, high profile event and sudden spike of industrial step load.
As a result, i-NET generates high accuracy forecast which will basically determines the accuracies of consecutive studies of DAPC i.e. Load Disaggregation, Capacity Planning and Distribution Network Master Plan.
Upon finalisation of Load Forecasting, i-NET allows automated Load disaggregation, where forecasted demand is disaggregated to distribution primary and secondary substations to generate 20-year demand forecast by asset. All demand transfers between assets to optimise asset utilisation are handled within i-NET properly recorded on a geospatial unified platform as illustrated in Figure 2D.4.
2. Asset Investment Planning and Management (AIPM) for MV Assets
The AIPM establishment in i-NET focuses in achieving end to end Core CAPEX lifecycle management with automated project evaluation, CAPEX portfolio optimisation as well as post implementation impact tracking. It comprises of 5 main capabilities as deliberated below:
a. Project Life Cycle Management and Tracking which provides single source of truth for CAPEX lifecycle management.
b. Project Assessment & Risk Management which enables automated identification of “effective” CAPEX to avoid potential OPEX evaluated by unique needs of local area characteristics leveraging on concept of risk or value-based decision making.
c. CAPEX Portfolio Planning & Optimisation which can be broadly classified as mathematical optimisation of CAPEX portfolios against constraints or targets i.e. short term / medium term strategic objectives of the organisation, allowable CAPEX allowances specified by regulators, availability of resources and elements of related nature. This allows agile optimisation of CAPEX portfolios for optimum value creation within Regulatory Period targets.
d. Periodic Revision of Budgetary Requirements allows centralised CAPEX lifecycle management by distribution planners to ensure optimal utilisation of CAPEX adjusted against constraint faced during implementation to avoid prolonged stagnation of CAPEX or project.
e. Interactive Dashboards for Performance Monitoring provides easy performance tracking by middle management.
In a nutshell, digitalisation of abovementioned capabilities is expected to yield enhanced process efficiencies, enhanced risk management, enhanced investment evaluation, enhanced portfolio evaluation, improved system project outcomes and overall bullet proofing of DN’s CAPEX proposal accompanied by risk monetization and proven value creation. Figure 2D.3 shows a conceptual illustration of AIPM capabilities in i-NET.
DYNAMIC LINE RATING
As electricity demand continues to rise and renewable energy integration accelerates, power grids face increasing pressure to maximize efficiency, reliability, and capacity. Long-established methods of managing transmission lines by Static Line Ratings (SLR), use safe operating capacity as power transfer limits, often leading to underutilization of potential capacity such as lower transfer limits for 500kV backbone network to account for the risk of overloading the remaining lower-kV network if the backbone trips. This assumption-based approach limits grid flexibility and results in needs for development of new transmission infrastructure. There is also a scenario of sudden rise in supply applications, such as the influx of data centers, which requires the fast-tracked development of new infrastructure amid challenges.
To address these challenges TNB in December 2024 has successfully piloted Dynamic Line Rating (DLR) at its 132kV and 275kV in southern part of the peninsular. The DLR is an advanced grid technology that enhances real-time monitoring and optimizes transmission capacity based on actual operating conditions. The DLR is a real-time grid optimization technology that dynamically forecast power transfer limits based on actual environmental and conductor conditions, such as wind, temperature, and line sag. Unlike SLR, which applies static limits, DLR leverages on real-time data to determine a line’s true ampacity, allowing grid system operator to increase power transfer limit without compromising grid stability and system reliability.
The implementation has increased the transfer limits of selected existing lines by 20-40%, allowing grid system operator to transfer more power, reduce congestion if needed, and provide dynamic rating forecasts for up to 72 hours.
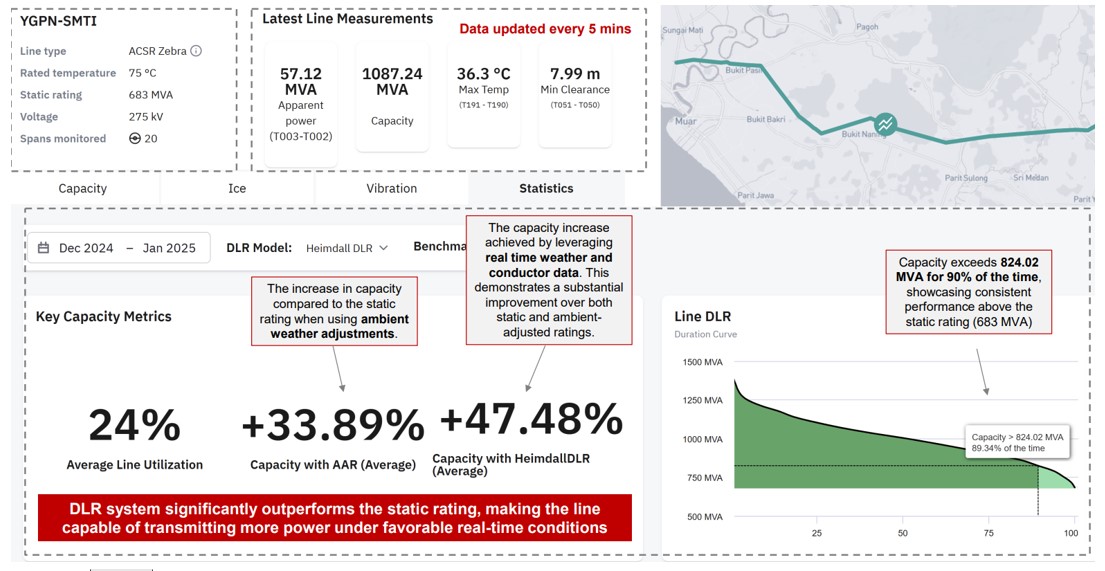
Figure 20: DLR dashboard capable of forecasting dynamic capacity based weather and conductor data up to 72 hours
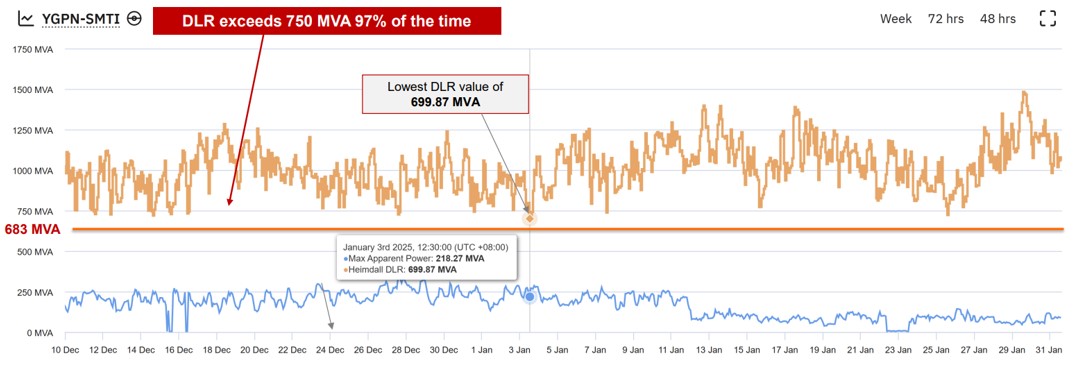
Figure 21: DLR dashboard show line capacity higher than static rating
By embracing real-time digital solutions like DLR, TNB equips the grid system operator with a solution for more flexible dispatching decision and for the division to accommodate for new infrastructure development.
MACHINE LEARNING FOR 11KV UNDERGROUND CABLES
MACHINE LEARNING FOR 11KV UNDERGROUND CABLES
Despite adhering to established engineering protocols for preventive maintenance, TNB faces a significant challenge in maintaining its 11kV underground power cables which significantly contribute to TNB's System Average Interruption Duration Index (SAIDI), with 70% of disruptions attributed to it.
The current operational guidelines rely on preventive and condition-based monitoring, involving a three-tier testing phase:
- Worst performing feeder identification
- Insulation resistance assessment
- Partial discharge mapping
However, the focus primarily on insulation and partial discharge characteristics has resulted in operational inefficiencies characterized by false positives and false negatives. False positives trigger unnecessary maintenance actions, while false negatives miss opportunities for early detection. To address these issues, there is an urgent need for methods with superior predictive accuracy.
In response, TNB developed an AI-driven predictive maintenance model that transforms the management of 11kV underground cables into a data-driven, proactive system. By leveraging machine learning and predictive analytics, the model identifies potential cable failures well in advance, allowing targeted intervention and optimized maintenance scheduling. This approach moves beyond traditional maintenance strategies by integrating historical maintenance records, breakdown history, cable demographic data, and geospatial information into a comprehensive predictive framework.
A robust predictive model using machine learning algorithms has been developed using meticulously cleansed data from Kuala Lumpur and Selangor. Leveraging the power of the CatBoost, XGBoost, Random Forest, and Linear Regression algorithm through a stacking ensemble model, this model is trained on a multidimensional dataset comprising various factors, including IR test history, past maintenance records, breakdown histories, cable source and feeder information, cable lengths, cable age, and geospatial data. Further refinement is achieved through feature engineering, including normalization of insulation resistance values based on cable length and percentage decay calculations to identify insulation degradation trends. Data complexity is handled using techniques like t-SNE and PCA, while class imbalance is addressed through class weight adjustment in a 4:1 ratio.
The AI capabilities of the model enable rapid prioritization of high-risk cables and actionable insights for maintenance teams, enhancing grid reliability and operational efficiency. Unlike traditional condition-based maintenance approaches that require extensive sensor networks, this predictive model is cost-effective and scalable, relying primarily on historical and operational data rather than expensive real-time monitoring infrastructure. Its adaptability also allows deployment in urgent, high-priority scenarios, as well as geographically sensitive areas, ensuring uninterrupted electricity supply for both businesses and consumers.
Extensive evaluation against an independent 2022 dataset demonstrates exceptional model performance metrics:
- Accuracy rate: 91%
- F1-score: 73%
- Recall rate: 81%
These results underscore the significant improvement the data science-driven predictive framework offers for pre-emptive maintenance in 11kV underground power cable systems, overcoming the limitations of existing approaches.
The cable breakdown prediction model was meticulously designed to navigate the complexities and imbalances inherent in cable breakdown data. Trained on data spanning from 2017 to 2022, rigorous preprocessing steps, including outlier detection, missing value imputation, and normalization, were undertaken to ensure data quality.
By integrating AI-driven predictive analytics, TNB’s solution not only improves operational effectiveness but also contributes to long-term grid resilience. The model provides a benchmark for AI-powered smart grid management, enabling the utility to transition from reactive and preventive maintenance to a fully predictive, data-driven strategy.
With this model in place, the pilot implementation in Selangor and Kuala Lumpur was successfully completed in May 2025, achieving more than 90% prediction accuracy. Building on this success, the model is now in the process of being rolled out nationwide in phases, empowering operations teams to focus their efforts on prioritized areas and cable sections.
The data-driven predictive maintenance model represents a significant advancement in enhancing the reliability and efficiency of TNB's 11kV underground power cable infrastructure. It is poised to make a substantial positive impact on both TNB's operational effectiveness and the overall quality of service provided to customers.
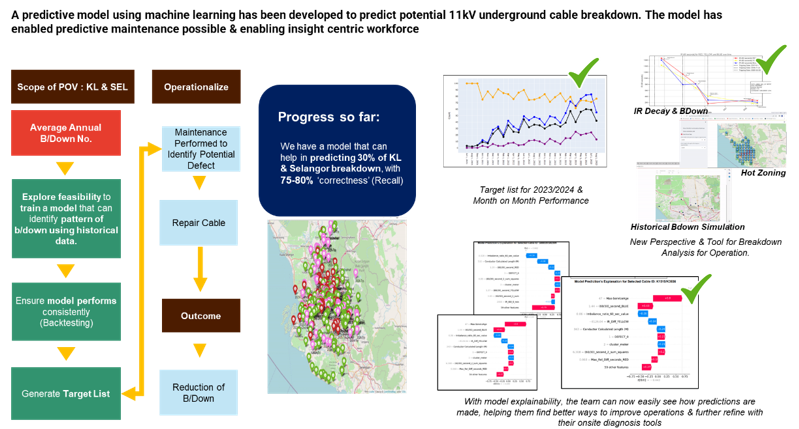
Figure 1: Predictive Machine Learning Model for 11kV Underground Cable
This initiative earned TNB the distinction of being named runner-up for both the Enlit Asia 2025 Power Utility Project of the Year and the Transmission & Distribution Network Award.
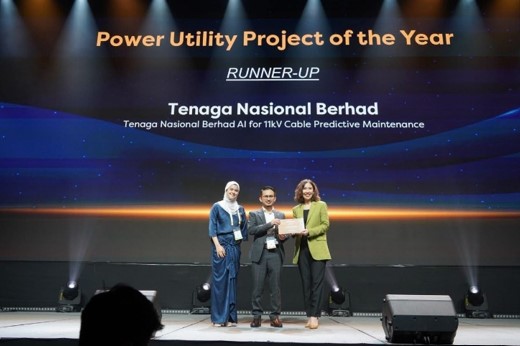
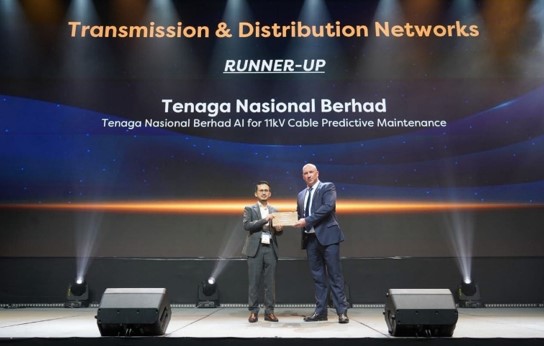
Figure 2: Runner Up for Enlit Asia 2025 Award for Power Utility Project of the Year and the Transmission & Distribution Network Category
DIGITAL TWIN APPLICATION IN TNB
DIGITAL TWIN APPLICATION IN TNB
INTEGRATED SPS DIGITAL TWIN AND REAL TIME SMART GRID ECOSYSTEM SIMULATION FOR SYSTEM INTEGRITY IN ENERGY TRANSITION
Since 2010, TNB Grid has implemented multiple in-house Special Protection Schemes (SPS) to enhance grid performance and prevent cascading trippings that could lead to a national blackout. However, as the network expands, frequent modifications to these SPS are required. Due to their critical nature, complete SPS outages for testing are nearly impossible, limiting tests to the modified segments. This partial testing presents significant challenges, as hidden failures may go undetected. Furthermore, network changes, such as the integration of Large-Scale Solar (LSS), introduce unforeseen dynamics that could impact SPS functionality. This fragmented approach and its associated challenges compromise the reliability of the SPS in service and increase the risk of a catastrophic supply interruption if the SPS fails to function as intended.
Overlooking the interconnected nature of these systems and making isolated modifications opened doors to potential malfunctions and mis-operations threatening to cause wide reaching impacts across the grid. Such a backdrop underscored the need for a cohesive, comprehensive, and forward-looking solution. TNB Grid is setting a new industry standard by leading the integration of the Digital Twin technology with the SPS, to holistically address these challenges. This innovative approach developed fully in-house champions the importance of leveraging modern technology to improve grid operation, offering a potential blueprint for other energy providers who aspire to achieve similar standards of grid reliability and foresight.
Integrated SPS Digital Twin was successfully developed in 2022 providing a robust platform to simulate, analyze, and understand the entire interconnected system of SPS. By mirroring the actual network, the Digital Twin enables comprehensive real-time simulations to anticipate and resolve potential grid issues, particularly when modifications to the SPS are made, even before they materialize. The initial investment is expected to yield substantial returns, not only in terms of direct revenue streams but also in cost savings, enhanced operational efficiency and the establishment of a robust, future-ready grid system. For example, the streamlined design and optimization process for SPS schemes translates to tangible savings of an estimated RM4.46 million for every major scheme deployed.
Integrated SPS Digital Twin combines two main components as follows:
1. Smart Grid Ecosystem using Real-Time Simulation Platform: Comprehensive end-to end real time hardware-in-loop simulation models and platform of the current and future TNB electrical grid system in Real-Time Power System Simulator (RTPSS) to address the following elements of a modern grid system:
- Prosumers (energy producer and consumer)
- Renewable Energy Sources (RES)
- Distributed Energy Resources (DER)
- Battery Energy Storage System (BESS)
- Microgrid systems
- High Voltage Direct Current (HVDC) System
- Flexible AC Transmission System (FACTS) devices
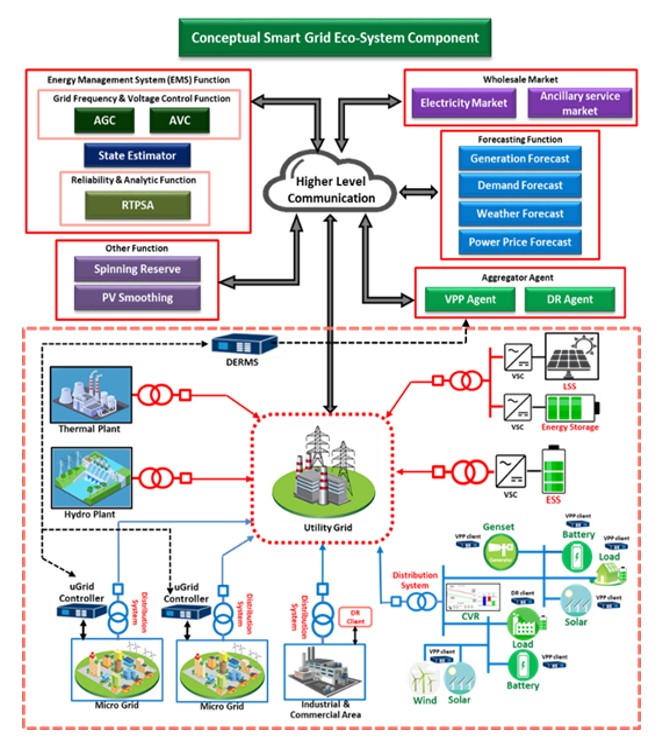
Figure 1: Smart Grid Ecosystem using Real-Time Simulation Platform
2. SPS Digital Twin: Emulate the entire SPS systems, replicating hundreds of Intelligent Electronic Devices (IEDs) and Real Time Application Platform (RTAP), specialized industrial PCs. This accurate mirroring enables advanced real-time power system dynamic simulations.
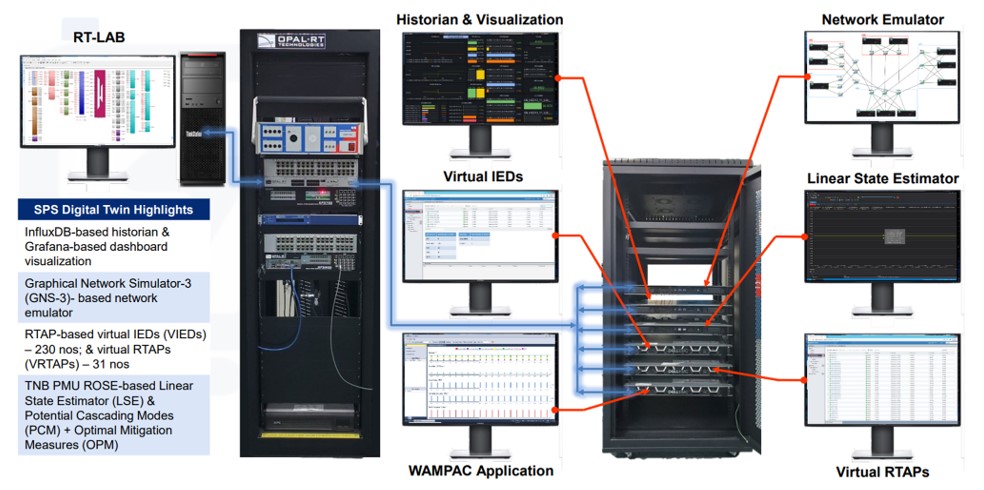
Figure 2: Setup of SPS Digital Twin Lab
Integrated SPS Digital Twin offers multifaceted benefits to the engineering domain. Engineers are now equipped with advanced tools to conduct comprehensive tests, ensuring a more reliable and secure grid. It cultivates a proactive mindset among professionals, emphasizing the value of preemptive measures in addressing challenges. This innovative solution reinforces the engineering profession's crucial role in shaping a resilient and sustainable energy future. Simulations using the Digital Twin identified loopholes in the existing SPS that could compromise its scheme from working as intended highlighting its high value in risk avoidance.
By adopting the Digital Twin technology specifically for SPS within the expansive smart grid ecosystem, TNB Grid not only addressed the immediate challenges of SPS management but also laid the groundwork for a more resilient and adaptive power network. This simulation platform also has the potential to unearth a plethora of investment opportunities. It sets the stage for exploring and validating various grid enhancing technologies and schemes before actual implementation. This is especially crucial in facilitating rapid growth in Renewable Energy (RE) integration under the National Energy Transition Roadmap (NETR). In 2024, another Special Protection Scheme (SPS) was successfully added to the network and the division leveraged on the SPS Digital Twin for countless of pre-installation and real-time simulations.
ENERGY INTEGRATION PLATFORM (EIP) – SMART ENERGY MANAGEMENT INFRASTRUCTURE (SEMI)
The deployment of the Smart Energy Management Infrastructure (SEMI) integrated with the Energy Integration Platform (EIP) is a key enabler in TNB’s digital transformation strategy. As Distributed Energy Resources (DERs) become more prevalent, SEMI-EIP is evolving towards a Digital Twin framework, providing a virtual replica of the energy network that enhances monitoring, visibility, and planning. By combining near real-time data streams with analytics and simulation models, SEMI-EIP enables anticipation of system behaviour, test scenarios, and optimize network performance. Its core function is to deliver near real-time insights and predictive intelligence across multiple network layers, from DERs to the Low-Voltage (LV) network, supporting a resilient, decarbonized, and customer-centric energy ecosystem.
The SEMI-EIP module has been successfully implemented across various strategic use cases, including:
a) Elmina Residential Solar Community
Located in a residential area with high rooftop solar penetration, the Elmina site focuses on low-voltage network performance. SEMI-EIP consolidates data from Smart Meters, Voltage-Regulated Distribution Transformers (VRDTs), Online Feeder Pillars, and Energy Storage Systems, enabling near real-time monitoring and analytics. The platform is used to observe reverse power flow conditions, battery state of charge, and voltage profiles at feeder level. This showcases SEMI-EIP’s ability to enhance visibility into distributed energy flows and support system reliability.
b) Green Island Projects – Pulau Perhentian, Pulau Redang, and Pulau Tioman
These islands serve as pilot sites for hybrid and renewable microgrid systems. Pulau Perhentian and Pulau Redang operate as off-grid hybrid systems integrating solar photovoltaic (PV), vertical-axis wind turbines (VAWT), liquefied natural gas (LNG), and diesel generators. Pulau Tioman, while connected to the mainland grid, incorporates significant renewable generation and localized energy assets. SEMI-EIP supports monitoring and planning for these diverse energy mixes, improving situational awareness and strategic decision-making for microgrids.
Challenges Addressed
The rapid growth of DERs has introduced several operational and planning challenges. A major issue is the limited visibility across low-voltage and islanded grids, especially where DERs are installed behind the meter. Undetected reverse power flows can lead to voltage regulation issues. Existing monitoring systems are often fragmented, lacking unified data consolidation needed for effective planning. Hybrid microgrids with variable generation sources and dynamic demand profiles further increase complexity. SEMI-EIP addresses these gaps by providing a unified platform for data aggregation, monitoring, and strategic analysis.
Implications without EIP
Without a consolidated Energy Integration Platform, utilities face significant risks. Fragmented monitoring leads to suboptimal DER integration, increasing the likelihood of power quality issues and other operational blind spots particularly in LV and off-grid networks. This limit proactive responses to network conditions. This reactive approach increases operational costs and undermines strategic planning. Furthermore, the lack of transparent visibility into energy flows and asset performance hinders the progress toward national decarbonization targets and long-term sustainability goals.
Strategic Positioning of SEMI-EIP
SEMI-EIP is strategically positioned as the analytical backbone of the modernized grid with high penetration of DERs into the network. It serves as a central platform for both near real-time monitoring and long-term planning in a decentralized energy environment.
1. Ultimate Dual Function of EIP includes Monitoring and Planning Tool
SEMI-EIP is designed to fulfil main two key roles apart from other supporting functionalities:
- Monitoring Layer – Enables near real-time observation of network behaviour, anomaly detection for instance reverse power flow or voltage deviation and performance tracking of distributed assets. For example, in the Elmina solar community, SEMI-EIP is used to monitor the loads and battery SOC at the LV level whereby this capability previously was unavailable.
- Planning Layer – Supports energy analysts and network planners in simulating DER impacts, planning battery sizing, estimating load growth and identifying grid reinforcement needs and requirement. It integrates asset-level data from VRDTs, smart meters, and online feeder pillars with forecasting models to inform smarter investment and operational decisions.
2. Enhancing Visibility in Hybrid & Remote Systems
SEMI-EIP improves situational awareness in hybrid systems such as those on Pulau Perhentian and Pulau Redang, where generation sources vary widely. It consolidates data to support planning for fuel optimization and renewable penetration. On Pulau Tioman, SEMI-EIP adds value by monitoring DER integration at the grid edge, ensuring reverse energy flows do not compromise upstream voltage profiles or grid safety.
Few snapshots of platformThis functionality demonstrates SEMI-EIP as a future-ready platform aligned with national energy transition goals, supporting net-zero ambitions and energy democratization.
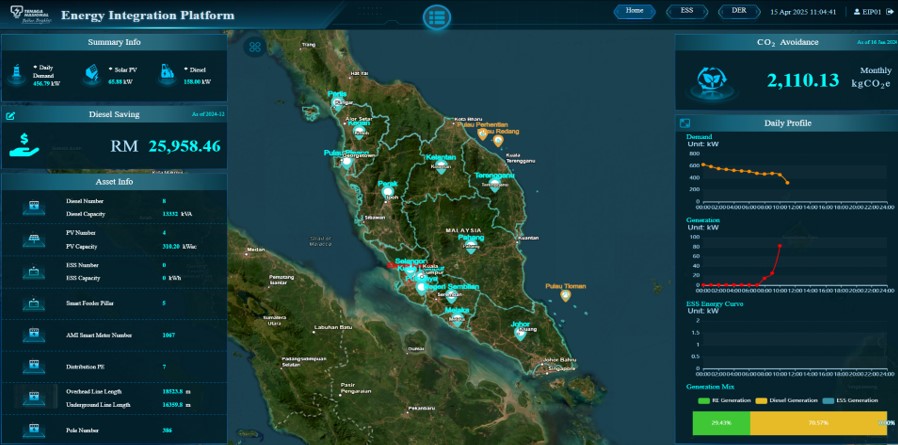
Figure 3: Home Page for Smart Green Island
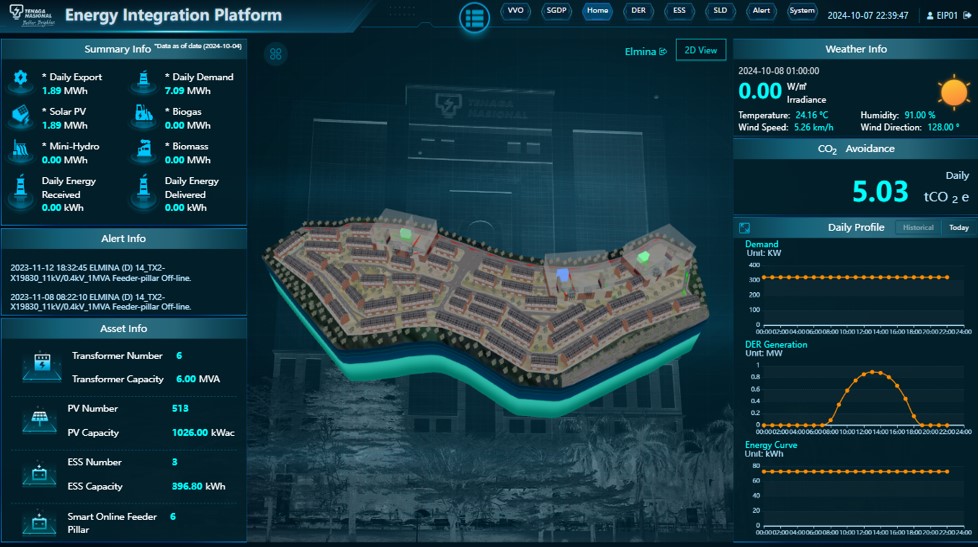
Figure 4: Home Page for Elmina Residential Solar Community

Figure 5: Energy Status in Smart Green Island
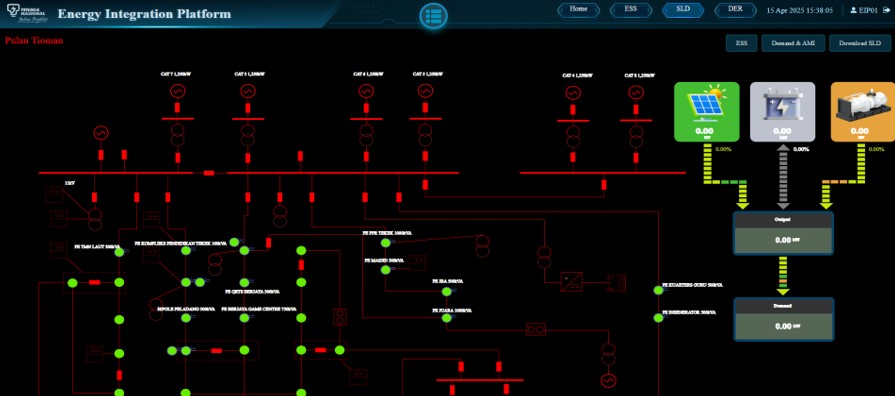
Figure 6: Single line diagram for network in Smart Green Island
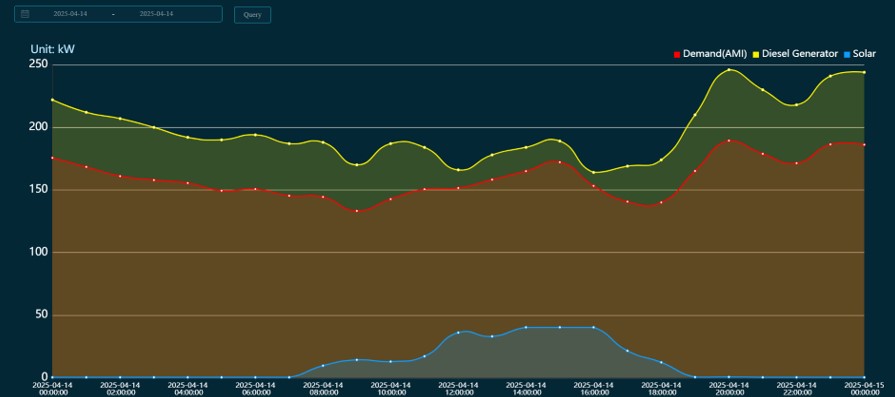
Figure 7: Supply and Demand Status in Smart Green Island
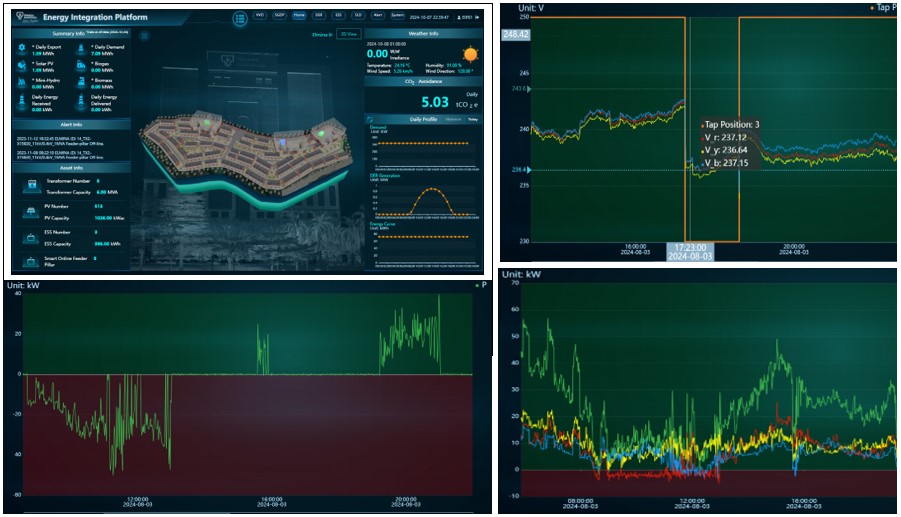
Figure 8: Dashboard monitoring in Elmina
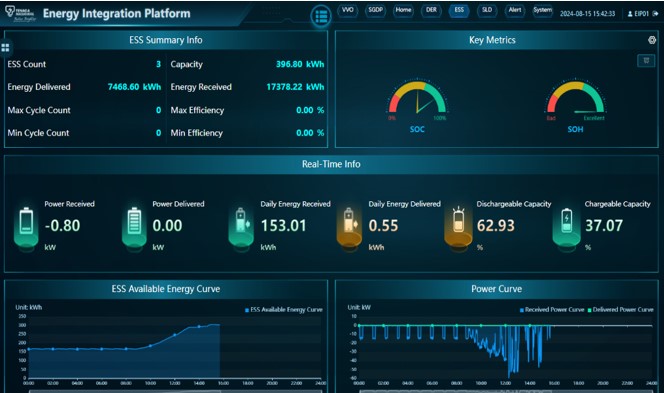
Figure 9: SEMI-EIP enabling Energy Storage Optimization and Load Balancing
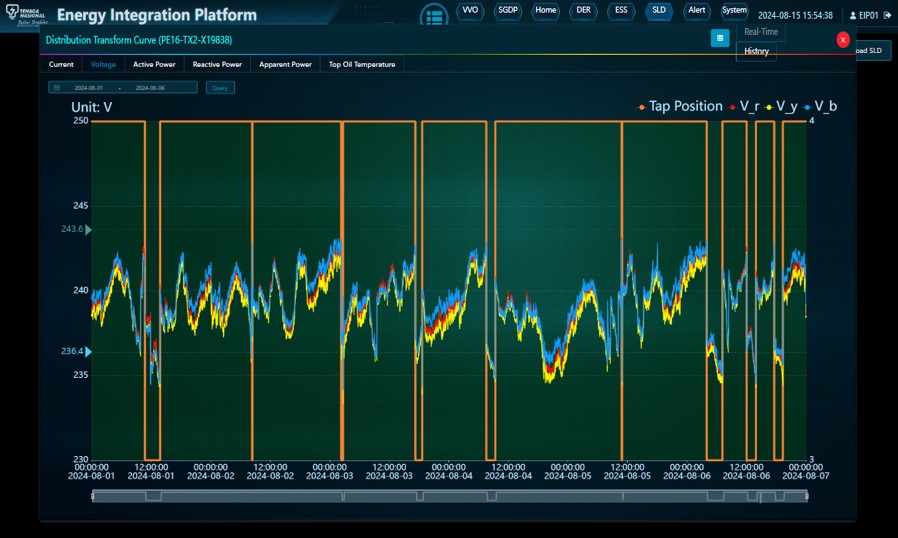
Figure 10: VRDT Performance monitoring
THERMODYNAMIC MODELLING OF TNB JANAMANJUNG’S MANJUNG 4 (M4) AND MANJUNG 5 (M5)
TNB Genco has embarked on a digital transformation journey by implementing a Digital Twin initiative at TNB Janamanjung’s Manjung 4 (M4) and Manjung 5 (M5) power plants specifically on Thermodynamic Modelling. This initiative aims to leverage advanced digital technologies to enhance operational efficiency, optimize asset performance, and drive data-driven decision-making.
The primary objective of the Thermodynamic Modelling initiative is to improve plant efficiency by utilizing real-time data analytics. By creating a virtual replica of the physical plant, operators can gain valuable insights into plant performance, identify inefficiencies, and implement corrective measures proactively.
This initiative integrates real-time operational data with an advanced thermodynamic model, enabling detailed calculations and in-depth performance analysis of the plant. This capability enables early detection of performance gaps, identification of underperforming equipment, and enables operators to take immediate action to improve plant efficiency, ultimately reducing fuel costs.
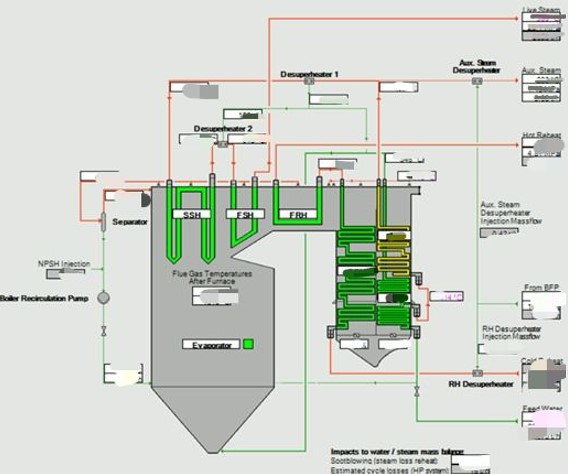
Figure 11: Monitoring on boiler performance
One of the key benefits of this initiative is the ability to monitor and assess the performance of major equipment, including turbines, boilers, and rotary machinery. By continuously tracking equipment health, the system can provide real-time insights, allowing for timely maintenance and lowering fuel costs. This enhances asset longevity and ensures optimal plant efficiency.
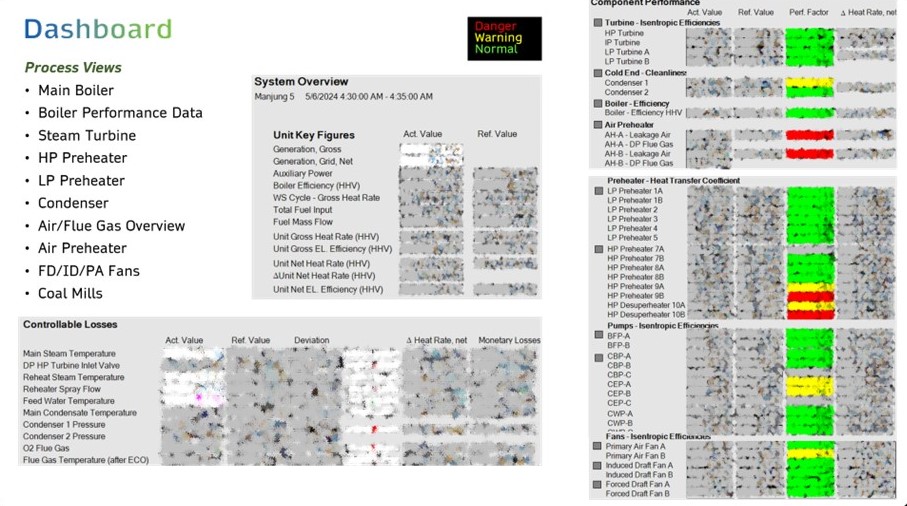
Figure 12: Dashboard monitoring on major equipment parameter
Building on the success of the Digital Twin implementation at M4 and M5, TNB Genco plans to expand this initiative to other power plants, particularly coal-fired power plants. This strategic expansion will further enhance operational efficiency across the fleet, support sustainability efforts, and contribute towards long-term carbon footprint reduction.
The Digital Twin initiative at TNB Janamanjung represents a significant step forward in leveraging digitalization to optimize power plant operations. With its ability to provide real-time insights, enhance equipment performance, and drive efficiency improvements, this initiative is poised to play a crucial role in the future of power generation at TNB Genco.
XWEKNOW: TNB’s SAFE AND RESPONSIBLE AI TOOL
WEKNOW: TNB’s SAFE AND RESPONSIBLE AI TOOL
As TNB continues its digital transformation journey, artificial intelligence (AI) has become a key enabler of innovation, efficiency, and compliance. To support employees in navigating TNB’s policies, guidelines, and technical manuals, TNB has introduced WeKnow, an internal Generative AI (GenAI) assistant.
WeKnow is more than a productivity tool. It embodies TNB’s commitment to safe, ethical, and responsible AI use. The system is designed to uphold key principles that guide AI governance across the organization:
- Human-Centricity – AI supports employees without replacing human judgment, keeping humans at the center of decision-making.
- Accountability – TNB takes full responsibility for AI-assisted decisions and outcomes due to the Human-In-The-Loop approach.
- Safety and Security – The AI is developed with safeguards to protect employees, the public, and the environment.
- Fairness – WeKnow minimizes bias and promotes equitable outcomes.
- Privacy and Data Governance – It complies with data protection laws and ensures careful handling of sensitive information.
- Transparency – Employees are given clear understanding of how WeKnow works, its limitations, and the basis of its outputs.
- Robustness – The AI performs reliably under different conditions and promptly flags any malfunctions for resolution.
- Social and Environmental Welfare – WeKnow contributes to social betterment and aligns with TNB’s sustainability goals, including the Net Zero by 2050 commitment.
In practice, WeKnow provides operational assistance to TNB employees by offering AI-powered guidance for internal policies, guidelines, and technical manuals. It helps employees:
- Access accurate information quickly, ensuring compliance and consistency.
- Follow the correct procedures and best practices in day-to-day operations.
- Make informed decisions while adhering to TNB’s safety, governance, and sustainability standards.
- Interact using voice commands for hands-free assistance and efficiency.
- Generate output files for documentation, reporting, or reference purposes.