ABOUT SUPPLY RELIABILITY
SUPPLY RELIABILITY
System Average Interruption Duration Index (SAIDI) and System Average Interruption Frequency Index (SAIFI) for TNB in this context, are major metrics used to assess the supply reliability and quality of electrical power service provided to customers in Malaysia. SAIDI measures the average duration of power interruptions experienced by customers served by TNB in Malaysia, typically expressed in minutes per customer per year. It is calculated by summing the total duration of all interruptions in a specific period and dividing it by the total number of customers served by the distribution system. The formula for SAIDI is as follows:
SAIDI = Total Duration of Interruptions (in minutes)
Number of Customers
On the other hand, SAIFI, or System Average Interruption Frequency Index, measures the average number of interruptions experienced by customers over a specific period. It is calculated by summing the total number of interruptions during a given time frame and dividing it by the total number of customers. The formula for SAIFI is:
SAIFI = Total Number of Interruptions)
Number of Customers
These metrics are essential for TNB to monitor and improve service quality and reliability, meeting the needs and expectations of its customers. They also serve as benchmarks for performance against industry standards and help guide investments to reduce both the frequency and duration of power outages. By focusing on both SAIDI and SAIFI, TNB can ensure a more robust and reliable electrical distribution system for its customers.
XSAIDI & SAIFI PERFORMANCE FOR TNB
SAIDI & SAIFI PERFORMANCE FOR TNB
TNB has set an annual SAIDI target for 2024 of between 48 to 50 min/customer/year and will continue to monitor SAIDI for 15 selected cities in urban areas as shown in Table 3.1. As per the Performance Indicator (PI) guidelines, Energy Commission has granted approval for the inclusion of five SAIDI cities up to year 2021, along with the addition another ten new SAIDI cities up to year 2024. The established target for these cities is 35 min/customer/year.
| Selected cities for SAIDI Urban (2018-2021) | Selected cities for SAIDI Urban (2022-2024) | Remarks |
| 1. Kuala Lumpur | 1. Ipoh | Average performance of the specified 15 cities, weighted according to energy sales in each city. |
| 2. Shah Alam | 2. Malacca City (Melaka Barat) | |
| 3. Petaling Jaya | 3. Alor Setar | |
| 4. Johor Bahru | 4. Kuala Terengganu | |
| 5. Pulau Pinang (Island) | 5. Iskandar Puteri | |
| 6. Seberang Jaya | ||
| 7. Seremban | ||
| 8. Subang Jaya | ||
| 9. Pasir Gudang | ||
| 10. Kuantan |
Table 1: List of cities for SAIDI Urban
Sustaining a SAIDI metric of 48 minutes for TNB represents a commitment in ensuring a high level of power supply reliability for our valued customers.
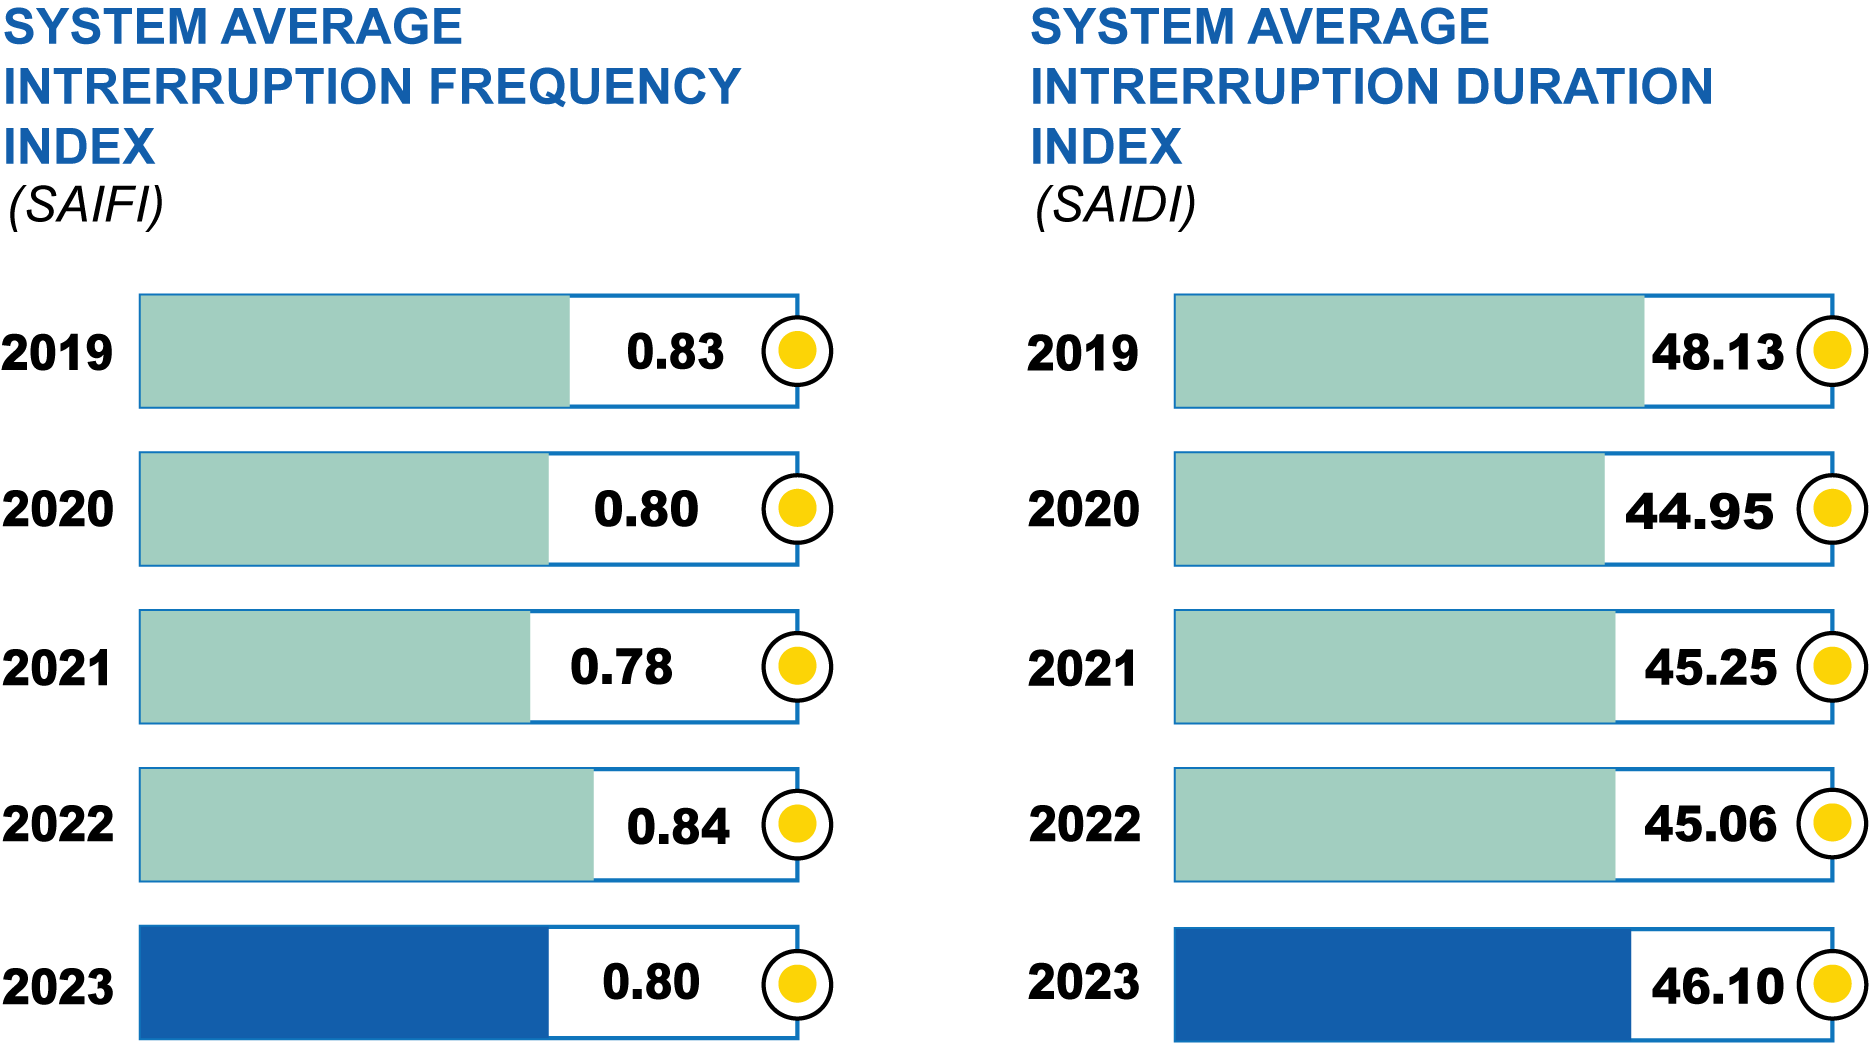
In 2023, we maintained world-class grid performance with System Minutes (Transmission) of 0.48 minutes and SAIDI (Distribution) of 46.10 minutes. This was achieved with the implementation of the ISO 55001 Asset Management System, a systematic and structured approach to ensure optimum asset performance throughout the life cycle, such as risk-based preventive maintenance leveraging data analytics. This solidifies its reputation as one of the most dependable electricity providers among ASEAN countries, all while maintaining highly competitive tariff rates. Notably, TNB achieved an impressive SAIDI score of 26.23 minutes for Kuala Lumpur, underscoring its exceptional reliability in the city. In 2023, TNB also saw an improvement in its SAIFI, reducing interruptions to 0.80 per year. Beyond monitoring the overall SAIDI performance index, TNB has expanded its monitoring to cover 15 cities, which are equivalent to other utility Central Business Districts (CBDs). The SAIDI target set for these 15 cities is 35 minutes, and as of December 2023, their performance stands at 38.97 minutes, showcasing TNB's ongoing commitment to service reliability.
|
SAIDI |
2019 |
2020 |
2021 |
2022 |
2023 |
|
Target : 50 Achievement: 48.13 |
Target : 50 Achievement: 44.95 |
Target : 50 Achievement: 45.25 |
Target : 50 Achievement: 45.06 |
Target : 50 Achievement 46.10 |
*Targets are referred to TNB DN 5 Years Plan
Table 2: Sustaining SAIDI

Figure 1: SAIDI and SAIFI FY2023 from TNB’s Annual Report Page 78
SAIDI INITIATIVES
SAIDI INITIATIVES
Achieving and maintaining this standard requires a strategic and proactive approach through robust system planning and diligent asset maintenance. To achieve this goal, TNB Distribution concurrently invests in modernizing and upgrading its infrastructure to mitigate the risks of power interruptions. This includes the implementation of cutting-edge technologies, grid automation, and effective load management systems. Regular maintenance and inspection of critical assets, such as transformers and substations, should be prioritized to prevent unexpected failures. Moreover, effective monitoring and predictive maintenance using data analytics helps identify potential issues before its escalated into major disruptions. By aligning our strategies with system planning and asset maintenance best practices, TNB Distribution consistently delivers on the promise of a SAIDI metric, ensuring a reliable and uninterrupted power supply for our customers.
Strategy For Supply Reliability Through System Planning
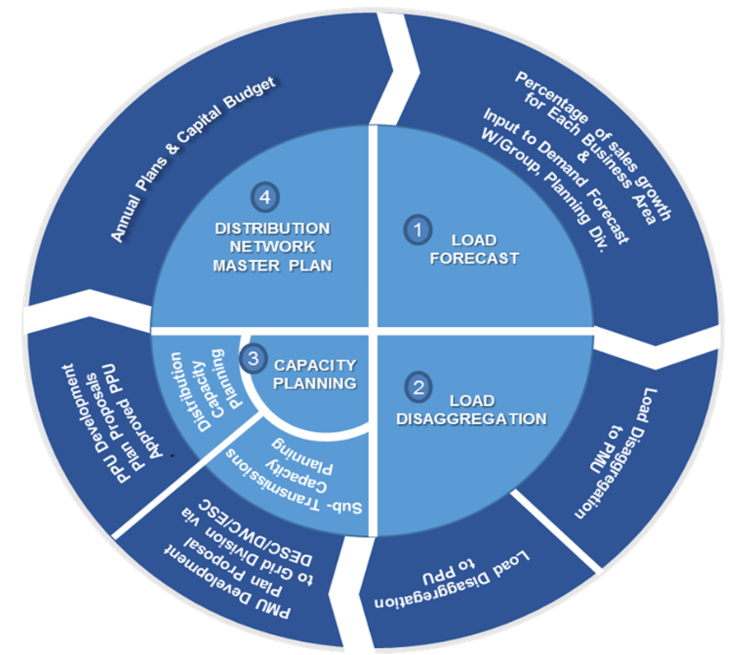
TNB's strategy for ensuring supply reliability through systematic planning is grounded in the principles of Life Cycle Asset Management. This approach is aimed at meticulously planning and expanding our network to enhance system performance while maintaining cost efficiency. To ensure that our network has the necessary capacity, we follow an annual review process, illustrated in Figure 1, which encompasses several key activities:

Figure 1: Planning Cycle Activities
Load Forecasts
These forecasts are based on historical sales data, local factors, and economic indicators. We perform 20-year forecasts annually to anticipate future demands accurately.
Load Disaggregation
In this step, we break down projected demand into state and supply zones. The final demands for each state or supply zone include projections for the growth of demand at Transmission Main-Intake Substations (PMUs) over the 20-year planning horizon.
Capacity Planning
Consisting of Sub-Transmission Capacity Planning (STCP) and Distribution Capacity Planning (DCP)
Sub-Transmission Capacity Planning (STCP)
This involves evaluating the capacity versus demand outlook for each supply zone over a 10-year horizon. It identifies the risk of capacity shortfalls and the need for additional capacity development, including new PMUs or increasing the transformer capacity of existing ones.
Distribution Capacity Planning (DCP)
This is a similar analysis but at the 33kV distribution level over a 5-year planning horizon. It aims to pinpoint capacity gaps and the asset development requirements for Distribution Main Intake Substations (PPUs), mainly those operating at 33/11kV in the distribution system.
Distribution Network Master Plans (DNMP)
These plans are essential documents for the development of our distribution network. They involve the analysis of system security performance and related network enhancement needs for 33kV and 11kV systems in each supply zone. The DNMP report is reviewed annually to ensure that major distribution enhancement projects for 33kV and 11kV are identified, planned, and implemented within the 5-year (33kV) and 4-year (11kV) analysis horizon.
In addition to these planning activities, we identify and execute asset replacement programs based on established criteria and policies in line with best asset management practices. Considerations include the asset's health index, age profile, operational safety, and product support.
The list of 33kV and 11kV system development, system improvement, and asset replacement projects are compiled and prioritized based on their criticality for implementation. This prioritization follows methodologies such as Risk-Based Decision Making (RBDM), Financial Evaluation Template (FET), and Cost-Benefit Analysis (CBA). These practices ensure that we make informed decisions regarding the maintenance and expansion of our network to guarantee a reliable and resilient power supply for our customers.
Strategy for Supply Reliability Through Asset Maintenance
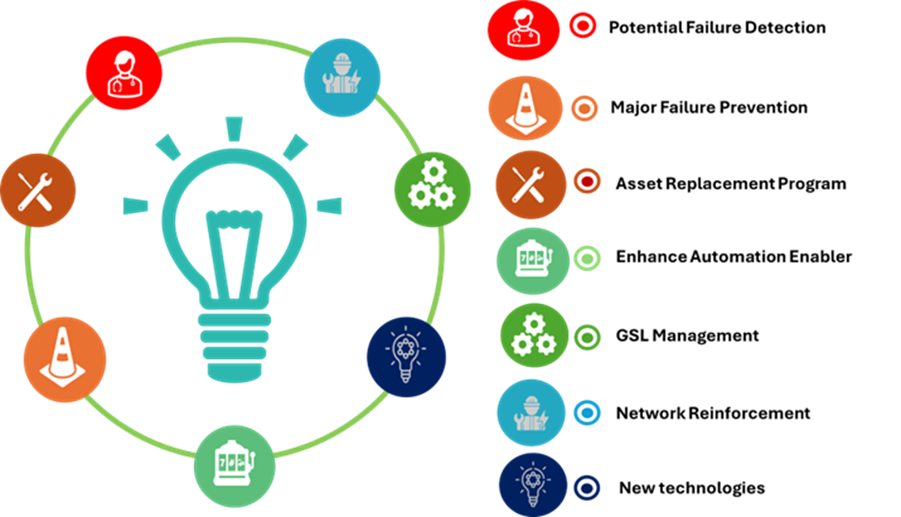
In managing TNB supply reliability, seven (7) core strategies of Sustaining SAIDI have been established in the distribution network where most assets are operating which as follows:

Figure 2: 7 Core Strategies of Sustaining SAIDI
Each strategy is supported by Initiatives as shown in Table 1.
| No | Main Strategies | Major Initiatives |
| 1 | Potential Failure Detection |
Online PD Scanning & PIDAR For MVUG Cable PD Mapping for MV Cable (OWTS) CBM For Switchgear (PMU/PPU/SSU 33kV) |
| 2 | Major Failure Prevention |
a. Commissioning of ARC Protection b. 11kV Project Injections |
| 3 | Asset Replacement Program | Replace MV Critical Cable Section |
| 4 | Enhance Automation Enabler | Distribution Automation Project |
| 5 | GSL Management | Cleansing Worst Performing Feeders * |
| 6 | Network Reinforcement | System Improvement and Development Project |
| 7 | New technologies | Introduction of New Technologies |
Table 1: Activities for sustaining SAIDI Performance
TNB has initiated a proactive approach to potential failure detection, incorporating Condition Based Maintenance (CBM) for underground cables, which employs the partial discharge (PD) mapping technique and online partial discharge detection. This system is instrumental in early defect identification, thereby mitigating the likelihood of substantial failures. Furthermore, TNB has extended CBM practices to 33kV switchgears, effectively reducing the risk of defects that could lead to flashovers.
In the realm of system safety, TNB has taken measures to avert catastrophic events through the installation and activation of arc flash protection schemes at PMUs/PPUs. These advanced systems have the capability to detect the initial stages of a flashover in AIS switchgear and promptly isolate the faulty section. Simultaneously, TNB's 11 kV project injections aim to enhance the overall reliability of the system.
In the context of the asset replacement program, TNB is focusing on the replacement of aging and high-risk installations that have the potential to trigger a substantial number of breakdowns, impacting a significant customer base. This category encompasses assets such as critical MV cable sections, including oil-filled cables, as well as high-risk PILC and XLPE cables.
To enhance SAIDI performance, TNB has intensified its deployment of the Distribution Automation (DA) Project. This strategic initiative enhances visibility across the distribution network, particularly at the Control Centre. By harnessing SCADA technology both at the Control Centre and within substations, real-time monitoring capabilities for field equipment are now seamlessly integrated. This empowers the Control Centre with the ability to remotely isolate faults and swiftly restore power during unplanned outages. For a comprehensive overview of these advancements, refer to Dimension 1.
Concurrently, TNB remains dedicated to optimizing restoration time. This involves the ongoing implementation of network automation through SCADA/DA systems, coupled with the integration of cutting-edge technologies. Leveraging SCADA/DA enhances the Network Controller's capacity to expedite supply restoration in outage scenarios.
Innovation is also a key focus, with TNB actively pursuing research and development initiatives aimed at enhancing equipment reliability to further mitigate SAIDI. Additionally, exploration into predictive analytics holds promise for proactively identifying potential faults, thereby contributing to sustained SAIDI reduction efforts. Please refer to Dimension 2 for detailed information on the proactive initiatives.
